BlockchainFX Trading Tools: What Can Multi-Chart Trading Do?
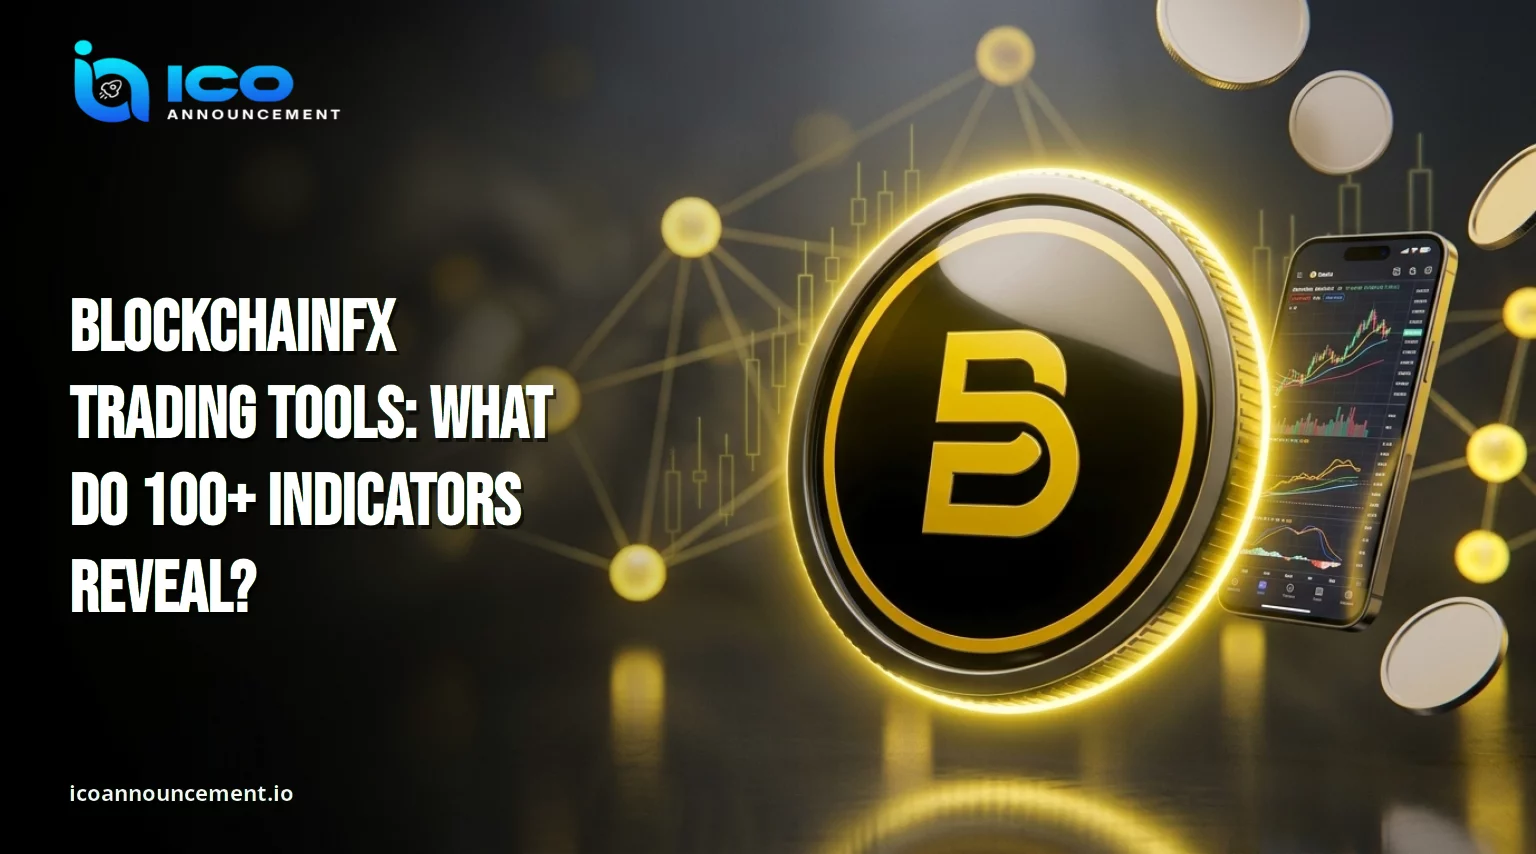
BlockchainFX advertises a layout of up to 9 charts and more than 100 indicators. That sounds impressive, but a bigger toolbox only helps if it improves how a trader reads the market.
This guide examines BlockchainFX trading tools through one question: do 100+ indicators clarify price action, or do they bury it under extra data? It separates what the project advertises from what you can confirm yourself, and it explains RSI, MACD, and moving averages in plain terms for newer traders.
Nothing here is a price prediction or a recommendation to buy or sell.
Does BlockchainFX Really Offer 9 Charts and 100+ Indicators?
The figures come from the project’s own product pages, which describe a multi-chart view with up to 9 charts and more than 100 indicators. That is a project claim, not an independently audited feature list.
The full indicator catalogue, the chart types open to every account, and any differences between the web platform and the mobile app are details a reader should confirm inside the product.
Before relying on a specific indicator, open the platform, search for it by name, and note whether it appears. The official page for BlockchainFX trading features is the place to check what is currently advertised, since feature lists can change after an article is published.
A count of 100+ shows how many studies exist, not how many are useful. Note the date of each check, because BlockchainFX trading tools can change.
What Can You Actually Do With BlockchainFX Multi-Chart Trading?
A multi-chart layout lets you watch several views at once. One panel can show a daily chart for the broader trend, another an hourly view for entries, and a third a related asset that tends to move with it. The value is context, because a price move looks different against a longer timeframe.
The risk is clutter: nine panels without a plan can slow decisions instead of speeding them up. Start with two or three. For the platform basics, our BlockchainFX app review looks at the live beta experience and what a new user sees first.
In practice, BlockchainFX trading tools of this kind work best when each panel answers a different question, such as trend, entry timing, or related-market context. Keep the same timeframes across sessions so comparisons stay consistent.
Which Technical Indicators Matter Most: RSI, MACD, or Moving Averages?
These three are the usual starting points, and none of them predicts the future. A moving average smooths price into one line, so a 50-day average shows the medium trend.
The price above it suggests buyers have been in control lately, while the price below it suggests sellers. The Relative Strength Index (RSI) measures momentum on a 0 to 100 scale.
Readings above 70 are often called overbought and below 30 oversold, though a strong trend can stay at either extreme for long periods. MACD compares two moving averages to show whether momentum is building or fading.
The CME Group page with moving averages explained is a neutral reference. These are general examples, and they do not confirm that each one is available on BFX.
How to Build a Beginner Trading Chart Without Indicator Overload
Use candlestick charts for price, then add one study for each job: trend, momentum, and volume. For example, a 50-period moving average for trend, RSI for momentum, and volume bars to see whether a move has real participation.
Mark support and resistance by hand where price has turned more than once. Choose the chart timeframe first, because a signal on a five-minute view means little against a daily downtrend. Three studies are enough to start.
Check the markets you plan to follow in our guide to supported trading assets, since liquidity and trading hours differ between asset types and change how reliable a pattern is. Save the layout once it works, then resist adding studies after a single losing position.
Can 100+ Indicators Give Better Signals or Create More Confusion?
More studies rarely mean more information. Many are built from the same price and volume data, so stacking RSI with several similar oscillators repeats one message in different shapes.
Conflicting readings are the bigger problem: one says buy, another says wait, and the trader follows whichever matches a hunch. A smaller set with clear rules is easier to test and review.
Also remember that a chart signal is not a guaranteed fill. The price you see and the price you get can differ, a point the platform’s trade execution policy covers through spreads, slippage, and order rejection.
Judge BlockchainFX trading tools by whether they improve decisions, not by how many appear in a menu. Test any rule on past data before risking money.
What Should You Check Before Trusting a BlockchainFX Trading Signal?
Treat every signal as a hypothesis and ask five questions. Which timeframe produced it? Does a longer timeframe agree? Is volume supporting the move? Where is the exit if the idea is wrong? How large is the position relative to the account? The last question matters most when leverage is involved, because a small adverse move is magnified.
Our explainer on cross vs isolated margin shows how the margin mode changes the amount at risk. No indicator, however well known, turns a probability into a certainty, and past patterns do not guarantee future results.
Write the answers down before entering. A short checklist removes the pull of the moment and makes mistakes easier to review later.
BlockchainFX Trading Tools: Features, Indicators, and Charting FAQs
The answer to the central question is that a toolset is only as useful as the habits behind it. Advertised features are a starting point, and verified ones are what you can open and test yourself.
One last check concerns what a chart actually prices. If an asset is offered as a contract rather than the coin itself, you are following a derivative, which is why the difference in spot versus CFD trading matters before any chart-based decision.
Used with discipline, BlockchainFX trading tools can make analysis clearer.
Used without it, they add noise. Verify before relying: open the platform, confirm each feature, and keep notes. Answers to common charting questions follow below.
Disclaimer: This article is for educational purposes only and is not financial advice. Market exposure carries a high risk of loss, and indicators do not guarantee outcomes. Feature descriptions reflect the project’s published claims and may change. Do your own research before using any platform.