

Is Dogecoin losing its footing, or is this just another shakeout in a long base? Dogecoin price prediction 2050 starts with that question, because the structure underneath decides how much weight any long-term headline can carry.
Buyers built a pattern over the past few months, but the market has just leaned the other way.
The next weekly closes will show whether sellers are in charge or simply testing patience.
Dogecoin Price Today: Market Cap, Volume and Supply
DOGE was trading near $0.081 per DefiLlama data, down 2.32% over 24 hours. Market cap is about $12.594 billion on 156.351 billion circulating DOGE, with fully diluted valuation almost identical because the supply is already out. 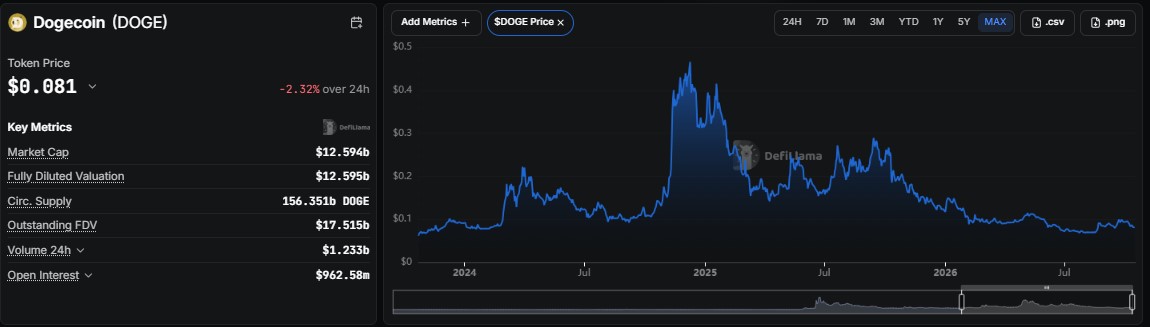
24h trading volume is around $1.233 billion. Dogecoin has no hard supply cap, so market cap math for the long term has to allow for continued issuance.
Data as of 17 October 2026.
Dogecoin Weekly Chart Analysis:
On the weekly chart, per TradingView, DOGE spent August to October coiling inside an ascending triangle, with a flat ceiling at 0.10538 and a rising floor drawn off the 0.06994 low. 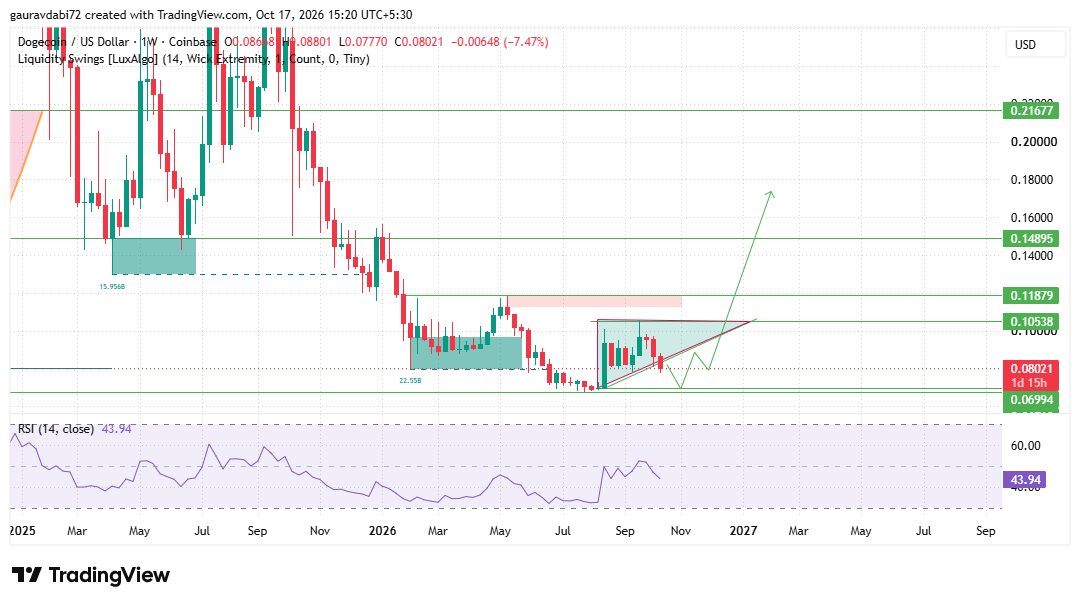
Ascending triangles usually lean bullish, but they only work while the rising floor holds. This week it did not.
The candle opened at 0.08648, swept to 0.07770, and is sitting near 0.08021, down 7.47% and below the triangle's rising line.
That turns the pattern from a launchpad into a warning. If the breakdown holds on a weekly close, the first real support is 0.06994, the low that started the structure, and no further marked floor shows below it on this chart.
A recovery would need to reclaim the rising line and then clear 0.10538, with 0.11879, 0.14895, and 0.21677 as the higher levels beyond that.
RSI at 43.94 sits below the midline, so momentum is not offering buyers much help yet.
For an earlier outlook, check out our Dogecoin Price Prediction 2040 and see how DOGE’s key levels and market trend have evolved.
Is the 300 Million DOGE Binance Transfer Bullish or Bearish?
TOP DOGE on X, a commentary account, flagged that 300 million DOGE, worth about $24.1 million, was just moved to Binance. That is roughly 0.19% of circulating supply. 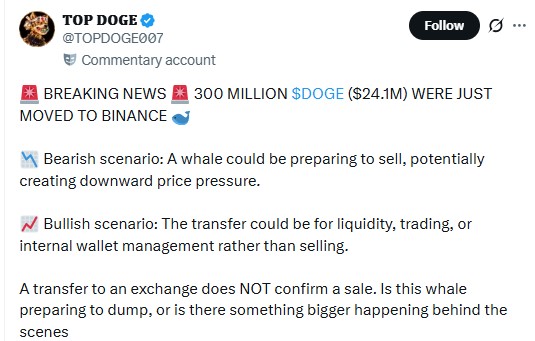
The post lays out both readings: a whale preparing to sell, or a move for liquidity, trading, or wallet management.
A transfer to an exchange does not confirm a sale, and the post itself says so. With the price already below its triangle, though, any follow-up selling would meet thin support.
Is Dogecoin Open Interest Falling With Price?
According to Coinglass, DOGE open interest is near $1.27 billion. It peaked close to $1.65 billion on 22 September, climbed from about $1.1 billion in July, and has eased as price slid from around $0.10 to $0.08. 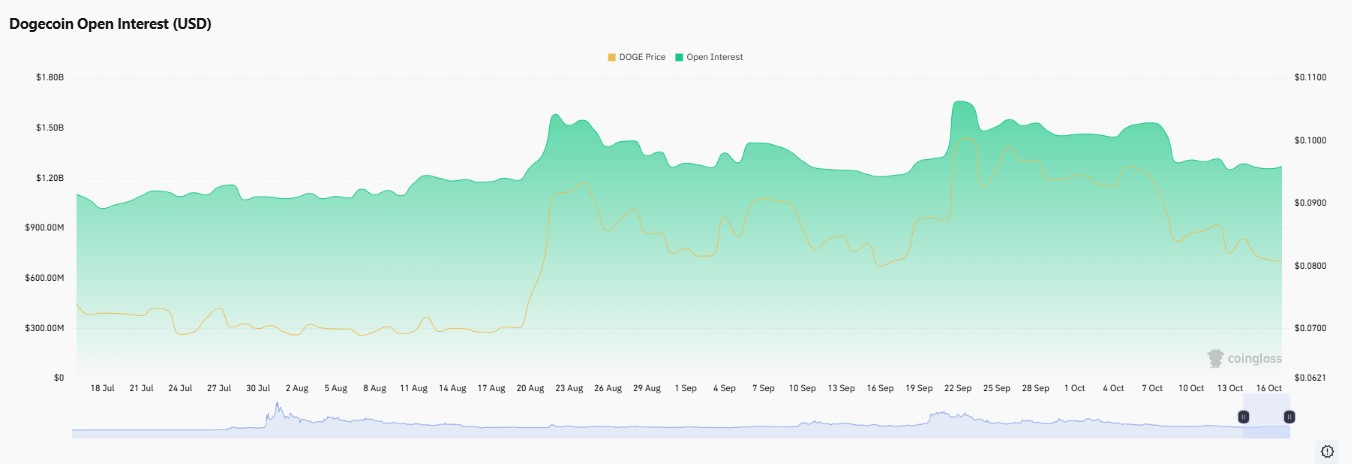
Shrinking leverage on a falling price suggests positions are being closed, not aggressively shorted. That lowers the risk of a violent squeeze but also removes the fuel for a quick rebound.
Can DOGE Reach $50 by 2050? The Long-Term Dogecoin Forecast
The math comes first. At the current circulating supply, $50 per DOGE implies a market cap near $7.8 trillion, about 620 times today's $12.6 billion.
Over 24 years, that needs roughly 31% growth a year, and further issuance would raise the bar.
No weekly chart can prove that, so this Dogecoin forecast keeps chart-backed levels apart from the long-horizon headline.
Key Risks for Dogecoin
A weekly close that stays below the rising trendline would confirm the breakdown.
Loss of 0.06994 would remove the last marked support on the weekly chart.
Exchange inflows from large wallets could add selling pressure if they turn into sales.
A $50 outcome rests on assumptions over 24 years that cannot be tested today.
Expert Opinion
As per the analyst desk, the triangle breakdown is the dominant fact on the chart, and 0.06994 is the line that matters if it holds.
A reclaim of the rising floor and a close above 0.10538 would change the picture, but until then the burden of proof sits with buyers.
Traders can compare this Dogecoin forecast with shorter-term outlooks to see how the levels connect.
Conclusion
Dogecoin price prediction 2050 begins with a plain read of the weekly chart: an ascending triangle has broken to the downside, price sits at 0.08021, and 0.06994 is the next real support.
A recovery above 0.10538 would reopen the upside levels, while a hold of the breakdown keeps pressure on.
The $50 figure is a long-horizon scenario, and the weeks ahead are where the real decisions get made.
Disclaimer: This article is for informational and educational purposes only and is not financial advice. Cryptocurrency prices are volatile and long-term projections are speculative. Always do your own research before making any investment decision.





