

Has Ethereum finally escaped its long downtrend, or is the market only catching its breath?
Ethereum price prediction 2050 depends on how this recovery behaves over the coming months, not just on the headline number.
Buyers have pushed ETH out of a heavy structure, yet the market is now stuck in a narrow range with a clear fork ahead. The next break will say a lot about how far this move can travel.
Ethereum Price Today: Market Cap, Volume, and Supply
ETH was quoted near $2,426 on Etherscan, down 0.93% on the day, with a market cap of about $296.3 billion.
DefiLlama shows a slightly higher reading of $2,476 and a market cap of $302.4 billion, which is normal when feeds refresh at different moments. 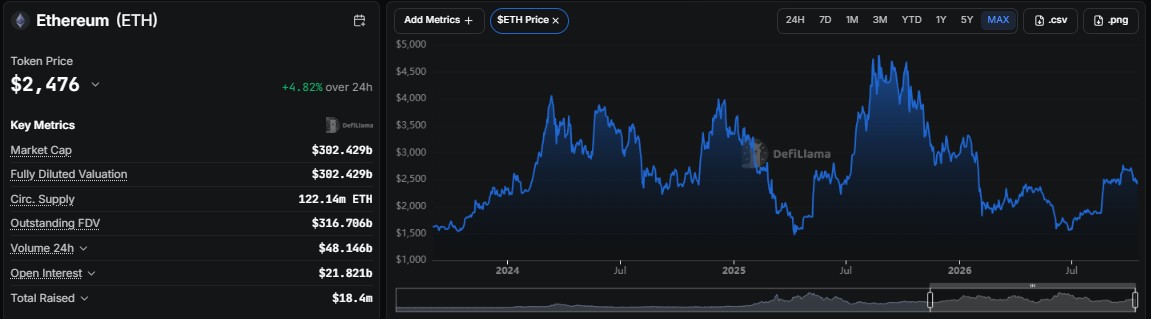
The same DefiLlama page lists a 24-hour trading volume near $48.146 billion and a circulating supply of 122.14 million ETH.
Data as of 17 October 2026.
Ethereum Weekly Chart Analysis: Descending Breakout and a Tight Range
Reading the weekly chart on TradingView the way a technician would, the first thing that stands out is the descending trendline drawn from the 2025 peak. 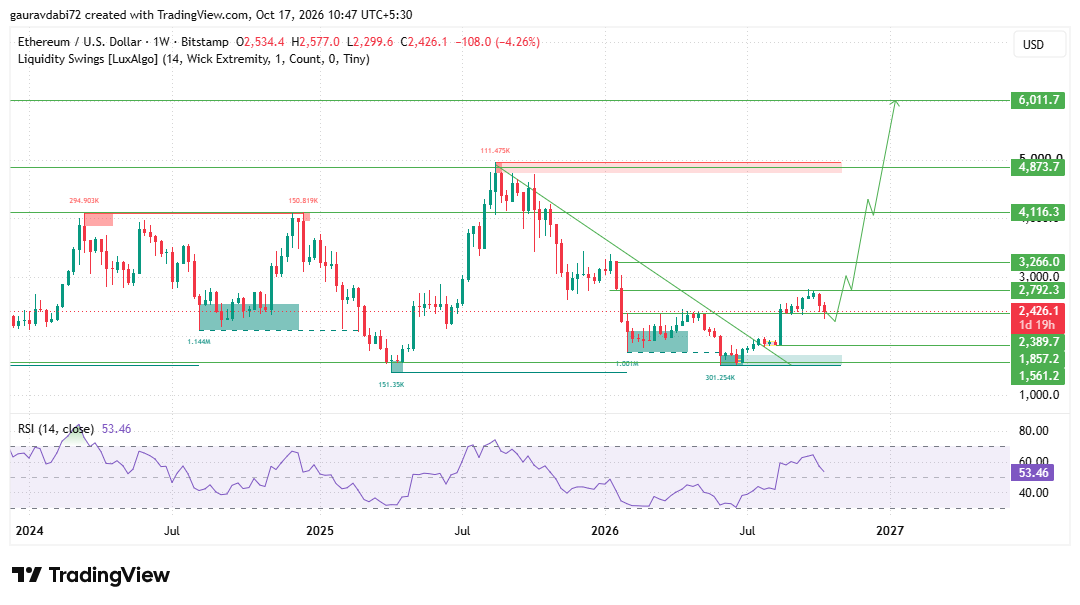
ETH broke above it this summer, lifted off the 1,857 area and pushed into 2,792 before sellers stepped in.
Since then the price has been working inside a range between 2,792 and 2,389, and that range is the whole story right now.
The current weekly candle shows why. It opened at 2,534, swept as low as 2,300, and has pulled back to 2,426, so buyers reclaimed 2,389 after a quick wick below it. That level is the range floor and the support that matters most.
A weekly close above 2,792 would confirm the breakout and open the path toward 3,266, then 4,116 and the 4,873 supply zone, with 6,012 as the highest marked level. If 2,389 gives way on a weekly close, the next floors sit at 1,857 and 1,561.
RSI at 53.46 is neutral and has cooled from its summer push, so momentum is not yet leaning either way.
For an earlier outlook, check out our Ethereum Price Prediction 2040 and see how ETH’s key levels and market trend have evolved.
Is Ethereum Open Interest Backing the Range?
Per Coinglass, ETH open interest sits near $30 billion, down from a peak around $36 billion in late September. 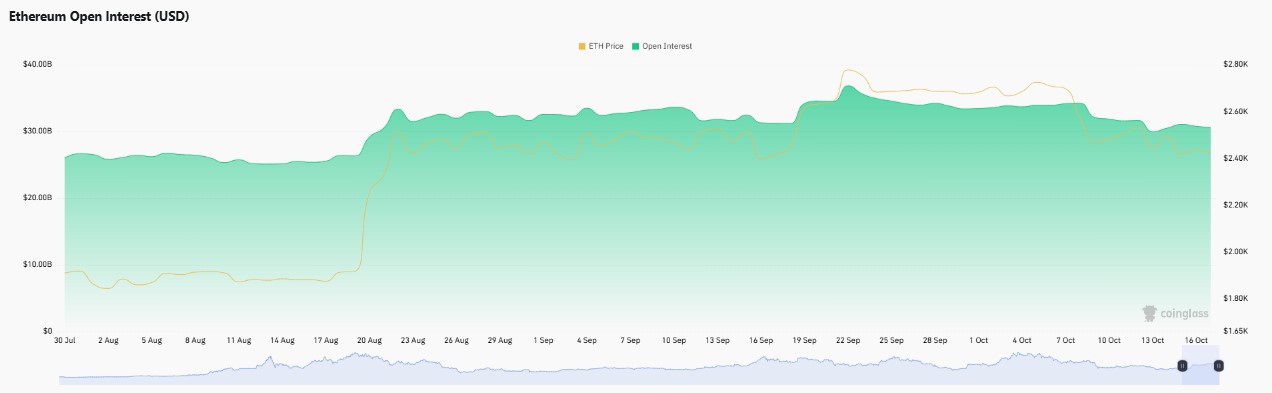
It climbed from roughly $26 billion in early August as the price jumped from the $1,900 area to about $2,450 on 20 August.
The recent drift lower, alongside the price slipping back from $2,700, suggests leverage is being trimmed rather than added.
That is healthy for a range, but a break above 2,792 will need open interest to rebuild to feel convincing.
Ethereum Network Activity on Etherscan
Etherscan data shows about 3,796 million total transactions, with the network running near 15.1 TPS and median gas at just 0.059 Gwei, under one cent.
Daily transactions over the past 14 days moved between roughly 1.5 million and 2.1 million.
Cheap fees and steady usage point to a network that is active without being congested, which supports the long-term Ethereum forecast but does not by itself decide near-term price.
Why Is The Money Ape Calling This Bullish for Ethereum?
The Money Ape posted that ETH based around the $2,400 demand zone in early 2025, faced rejection at resistance, then rallied over 125%. 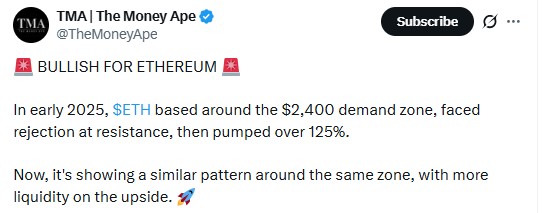
The account argues ETH is showing a similar pattern around the same zone now, with more liquidity on the upside.
It is a comparison, not a guarantee, but it lines up with the 2,389 support on the weekly chart.
Can ETH Reach $250K by 2050? The Long-Term Ethereum Forecast
The math comes first. At current supply, $250,000 per ETH implies a market cap near $30.5 trillion, about 101 times today's $302.4 billion.
Spread over 24 years, that needs growth of roughly 21% a year.
No weekly chart can prove that, so this Ethereum price prediction 2050 separates the chart-backed levels from the long-horizon headline.
The structure supports a climb toward 6,012 if the range resolves higher. Anything beyond that rests on Ethereum keeping its role as a settlement layer for decades.
Key Risks for Ethereum
A rejection at 2,792 would keep ETH locked in the range and invite another test of 2,389.
A weekly close below 2,389 would invalidate the reclaim and expose 1,857.
Falling open interest without a price breakout can signal fading conviction.
A $250K outcome depends on assumptions over 24 years that cannot be tested today.
Expert Opinion
As per the analyst desk, the descending breakout is the constructive part of the picture, and the 2,792 to 2,389 range is the decision zone.
A weekly close above the top with supportive volume would shift the bias firmly bullish, while a close below the floor would hand control back to sellers. Until one side wins, patience beats prediction.
Readers can compare this Ethereum forecast with shorter-term outlooks to see how the levels fit together.
Conclusion
Ethereum price prediction 2050 starts with a simple chart fact: ETH has broken a long descending trendline and is now consolidating between 2,792 and 2,389.
A break above resistance opens 3,266 and higher, while a loss of support points back toward 1,857.
The $250K figure is a long-horizon scenario, and the range ahead is where the real decisions get made.
Disclaimer: This article is for informational and educational purposes only and is not financial advice. Cryptocurrency prices are volatile and long-term projections are speculative. Always do your own research before making any investment decision.





