
Has Injective finally woken up? After months of quiet trading, buyers have stepped back in with real force, and the latest Injective price prediction debate is about whether this rebound can turn into a full trend.
Traders who ignored the token for most of the year are watching it again. Here is what the weekly structure says about the road ahead.
Injective Price Today: INJ Market Snapshot
INJ is trading near $9.04, up 19.92% over the last 24 hours, according to DefiLlama. 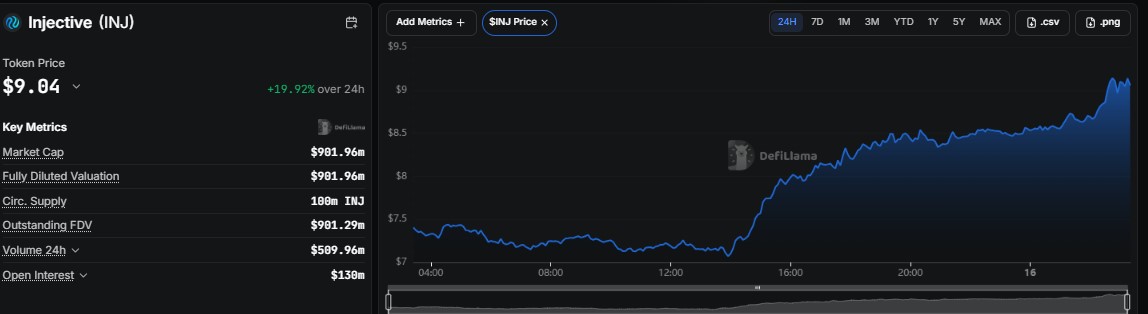
Market cap and fully diluted valuation both sit at $901.96M, which fits a fully circulating supply of 100M INJ. Daily volume reached $509.96M, more than half of the market cap.
The intraday chart tells the story clearly. Price hovered around the $7 area for most of the morning, then pushed higher in the afternoon and kept climbing into the evening.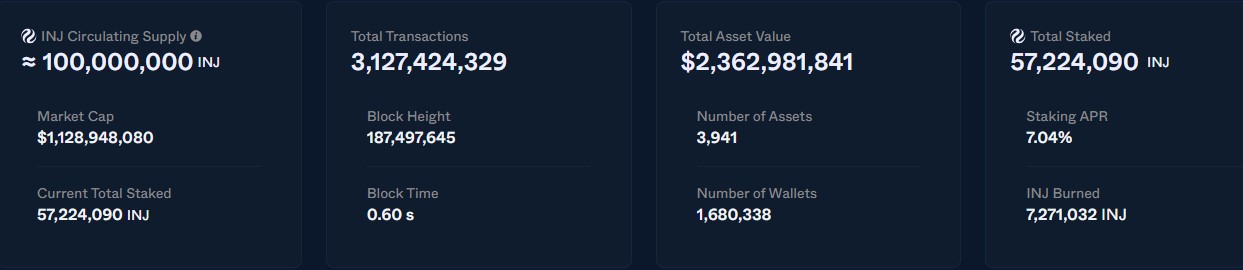
Network data from Injscan shows 57,224,090 INJ staked, roughly 57% of the supply, with a staking APR of 7.04%.
The chain produces a block every 0.60 seconds, has processed over 3.12 billion transactions, and counts 1,680,338 wallets.
Total asset value stands at $2,362,981,841 across 3,941 assets, and $7,271,032 INJ has been burned so far.
Injective is a Layer-1 blockchain built for financial applications, including decentralized finance and on-chain trading.
Network activity, application adoption, and ecosystem growth are the factors to watch when judging the longer-term outlook for INJ.
Why Is INJ Rising? Wall Street and Pentiv Headlines
Two posts from Injective on X are feeding the move. On 12 October the project teased that INJ is coming to Wall Street, a short message that kept details back but set an institutional tone.
The bigger catalyst arrived later. In a fresh X post, Injective said Pentiv is set to tokenize its entire $10 billion real estate portfolio on the network and bring its agentic operations onchain. 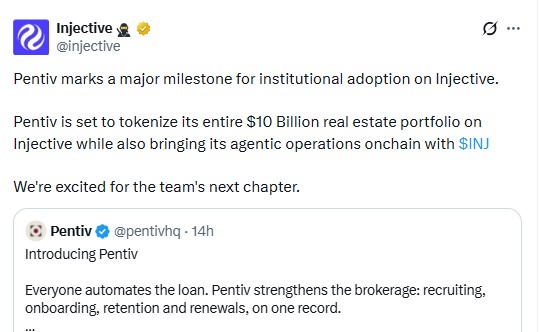
Pentiv describes its product as one record for brokerage recruiting, onboarding, retention, and renewals. Timelines were not given, so for now this is a strong narrative that still needs real on-chain activity behind it.
Real estate tokenization is part of the wider real-world asset RWA trend, which brings assets such as property, bonds, and commodities onto blockchain networks.
The long-term impact on INJ depends on whether announced plans turn into actual network usage.
Injective Open Interest: Is Leverage Building Behind the Rally?
Per Coinglass, open interest stood at $184.69M on 16 October at 05:30, with INJ near 50M levels of late April and above the roughly $150M to $160M peaks seen in late May and September. 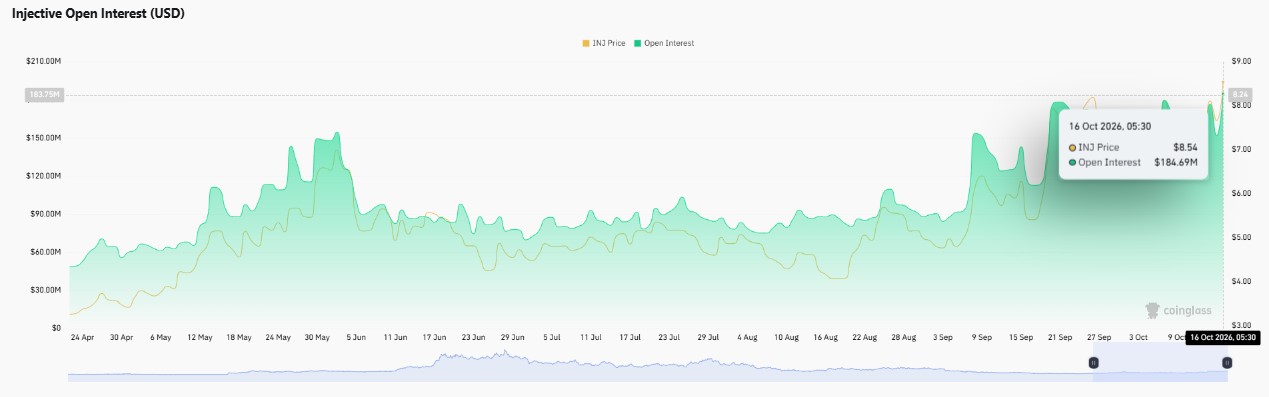
A rising price with rising open interest points to fresh positions entering, which supports the move but also leaves the market more exposed to sharp liquidation swings if momentum cools.
Injective Weekly Chart Analysis: Range Break and Higher Lows
Looking at the higher timeframe on TradingView, INJ slid hard from its 2025 highs and then spent much of 2026 stuck in a tight range between 2.794 and 6.985. 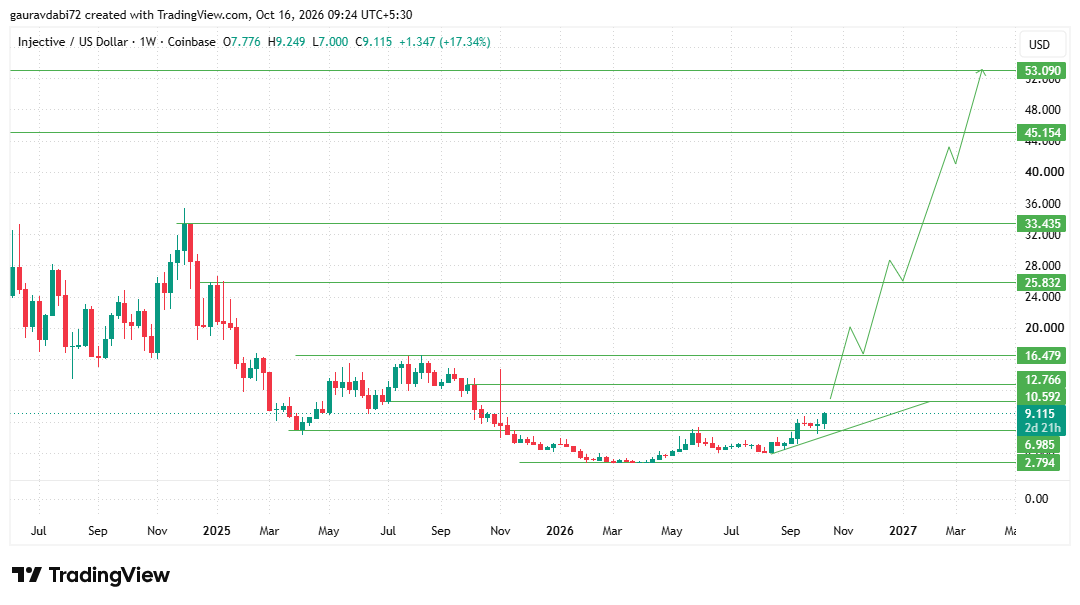
Sellers ran out of steam inside that box, and the break above 6.985 changed the structure.
Since then, the price has been printing higher lows along a rising trendline, which is how a base usually turns into a trend.
Traders can also lean on broader crypto technical analysis to see how breakouts, support zones, and resistance levels frame possible price scenarios.
The current weekly candle opened at 7.776, touched a low of 7.000 and a high of 9.249, and is trading near 9.115, up 17.34% on the week.
The candle still has a little under three days left, so the weekly close will say a lot. The first real test sits at 10.592.
Above it, 12.766 comes next, followed by 16.479, a zone where price stalled in mid-2025.
This Injective Price Prediction setup stays constructive as long as 6.985 holds, with 2.794 as deeper support.
Injective Forecast: Key Levels and Scenarios
In the base case, a weekly close above 10.592 opens the path toward 12.766 and 16.479.
If buyers keep control beyond that, the Injective forecast widens toward 25.832 and 33.435, with 45.154 and 53.090 as the outer levels.
The analyst desk view is that 53.090 could come into play within some weeks if buyers keep defending the rising trendline, but that remains the stretch case.
A weekly close below 6.985 would damage the structure and could send the price back toward 2.794.
For the headline question, $50 sits between 45.154 and 53.090. Reaching it in 2026 would mean more than a fivefold move from here, with every resistance zone above cleared along the way.
What Needs to Change for INJ to Reach $50?
Several things have to line up. Weekly closes above 10.592 need to be held rather than faded.
Open interest and volume must stay strong without a leverage flush resetting the market. Institutional headlines like Pentiv have to turn into visible on-chain growth, such as more assets and active wallets on the network.
A steady broader crypto market would also help, since INJ rarely rallies against it for long.
Key Risks for INJ Price
A near-20% single-day jump often invites profit-taking, and the unfinished weekly candle could still print a long upper wick.
Open interest at the highest point on the chart raises liquidation risk both ways. The Pentiv plan is an announcement of intent, and execution is unproven.
A loss of 6.985 would put the whole higher-low structure in question.
Expert Opinion on the Injective Price Forecast
As per the analyst desk, the Injective price forecast has moved from a range play to a trend play, and weekly closes are the tool that matters now. The 10.592 level is the gate.
A clean close above it, backed by steady volume and a calm derivatives market, would give the higher-low structure real credibility. Without that, the latest surge risks looking like another sharp rally inside a larger base.
Conclusion
INJ has broken out of its long range, built higher lows, and attracted fresh institutional headlines.
Whether the Injective Price Prediction of $50 in 2026 plays out depends on a weekly close above 10.592 and a market that does not overheat on leverage.
Until those boxes are ticked, caution and level-based planning make more sense than chasing the candle.
Disclaimer: This article is for informational purposes only and is not financial advice. Cryptocurrency prices are highly volatile, and readers should do their own analysis before making any trading decision.





