Is the Mirex price prediction pointing to a real recovery, or is the post-launch slide far from over?
Mirex (MRX) has been grinding lower inside a clean structure since its PancakeSwap debut, yet the latest bounce from support has traders asking whether selling pressure is finally fading.
This Mirex forecast breaks down the chart, the levels that matter, and what could come next.
Mirex (MRX) Price Today: Where Does the Token Stand?
According to Livecoin watch data, MRX is trading near $0.833, up 2.89% over 24 hours after moving between $0.799342 and $0.833280. 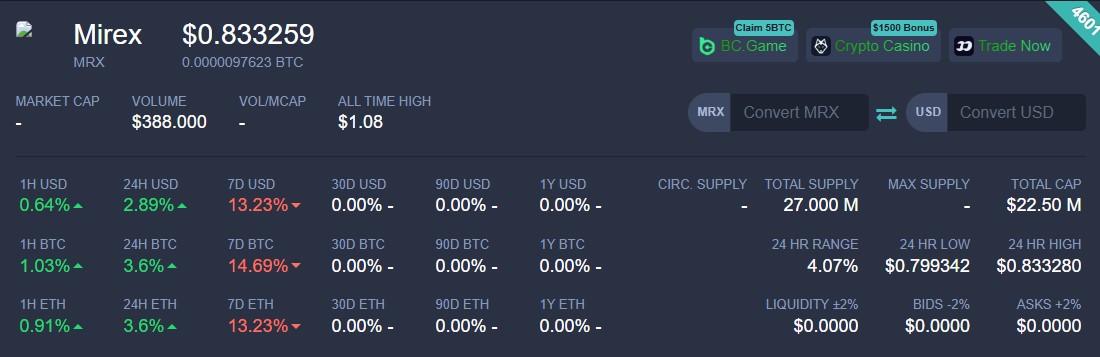
The weekly picture is weaker, with the token down 13.23% over seven days. Total supply is 27 million MRX, which puts the total cap at roughly $22.50 million. Daily volume is only about $388, so trading is very thin.
Mirex Network is built around its own MRX-20 chain and an RWA tokenization narrative, with a dual-token setup alongside Lumira.
MRX has traded on PancakeSwap on BNB Chain since early September. The presale price was $1.92, so the current level sits more than 55% below it.
Mirex 4H Chart Analysis: Descending Channel, Support and Resistance
Per TradingView chart data on the MRX/USDT pair on PancakeSwap v2, the price has been moving inside a long descending channel on the 4-hour timeframe. 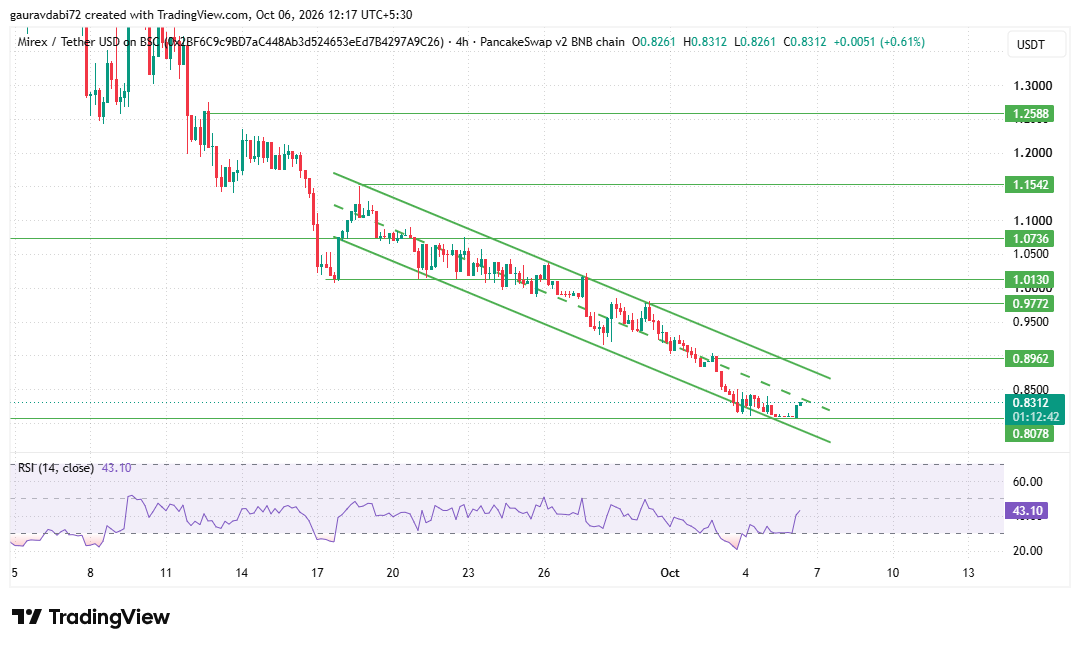
Since mid-September the structure has produced lower highs and lower lows, and each bounce has stalled at the channel's upper boundary or just beneath a horizontal level.
The most important area right now is immediate support at 0.8078. Price tested the lower channel line near this zone in early October and held, which is why the latest candles show a small recovery instead of fresh lows.
As long as this level holds, buyers keep a foothold. A 4H close below it would put the channel floor at risk and bring the 0.80 round area back into focus.
RSI (14) adds a supporting clue. It dropped into deeply oversold territory near the lows, then climbed back to around 43.10.
That is still below the neutral 50 mark, so momentum has improved but has not flipped bullish.
On the upside, 0.8962 is the first key resistance, and it lines up with the upper part of the channels.
That makes it the make-or-break level for the short-term structure. Above it, the next resistance levels sit at 0.9772 and 1.0130.
Further out, 1.0736 and 1.1542 mark the zone where price staged its steep slide in mid-September, and 1.2588 is the highest level on the chart.
Mirex Price Prediction: Possible Scenarios
Key Risks for MRX
Volume is the biggest concern. With 24-hour trading near $388, even small orders can move the price sharply, and false breakouts are common in this kind of market.
The token is also still well below its presale price, the structure remains bearish until the channel breaks, and trading is currently concentrated on a single DEX. Any move should be confirmed by volume before it is trusted.
Expert Opinion
As per the analyst desk, MRX is in a controlled downtrend with an early sign of stabilization, not a confirmed reversal.
The hold at 0.8078 and the RSI recovery are constructive, but a close above 0.8962 is the first real evidence that the trend is changing.
Until then, the Mirex Network price is better treated as a range-bound setup than a breakout story.
Conclusion
The Mirex price prediction stays cautious. Support at 0.8078 is holding, RSI is recovering, and the first resistance is within reach, yet the descending channel is still intact and volume is thin.
A confirmed break above 0.8962 would improve the outlook, while a loss of support would extend the downtrend.
Disclaimer: This article is for informational purposes only and is not financial advice. Cryptocurrency prices are highly volatile, and low-liquidity tokens carry added risk. Do your own research before making any investment decision.