Is PEPE finally ready to change its meme-coin story?
The Pepe price prediction 2029 debate has picked up as the weekly structure hints at an exit from a long downtrend, though buyers still have to prove they can defend it.
Here is how the Pepe forecast looks right now.
PEPE Market Cap, Volume and Supply Today
According to DefiLlama data, Pepe trades near $0.0000042 with a market cap and fully diluted valuation both at $1.784 billion. 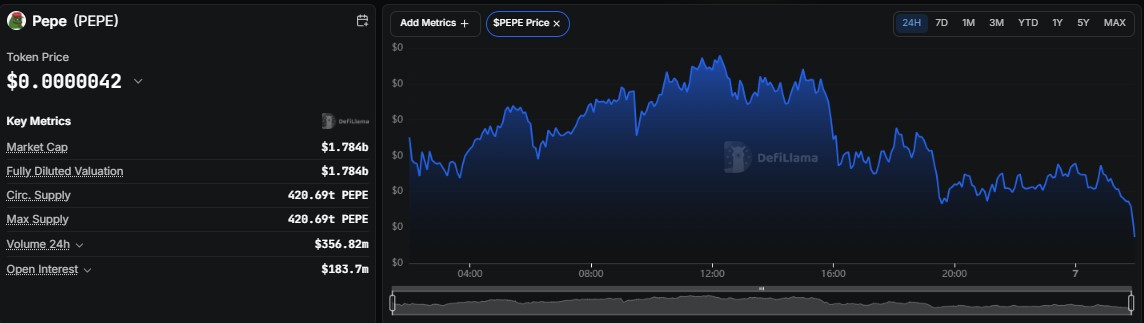
Circulating and max supply match at 420.69 trillion PEPE, and 24-hour volume reached $356.82 million, though the intraday curve faded into the latest hours.
Pepe Open Interest: Is Leverage Rebuilding?
Per Coinglass, PEPE open interest stood at $330.49 million on 7 October, with a price near $0.0000043, well above the lower readings of June and July. 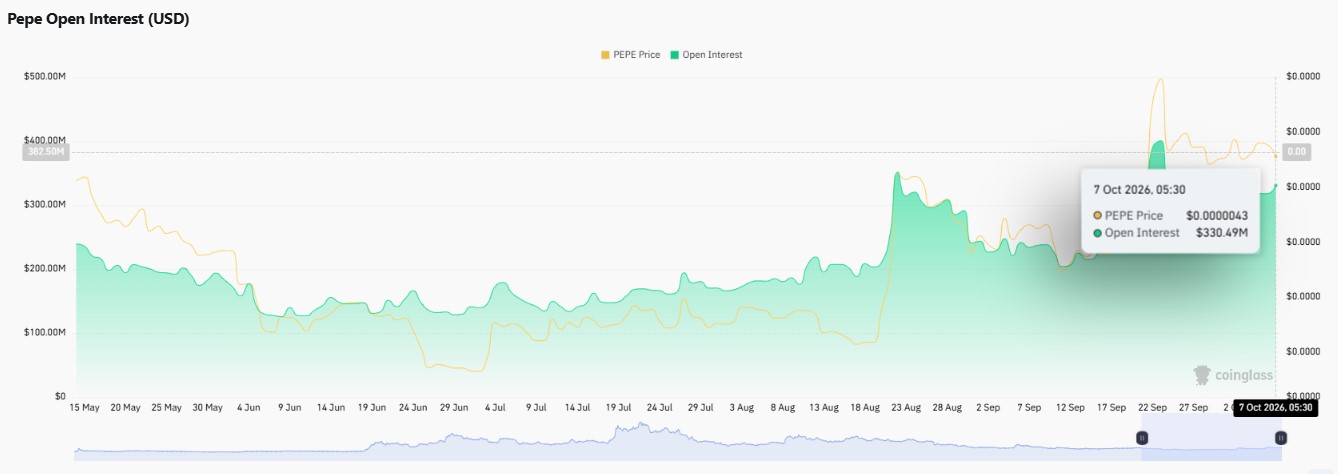
The Coinglass header now shows $299.01 million as the price slipped 4.06% to $0.000004115.
Futures volume of $348.29 million dwarfs spot volume of $62.66 million, so the read is mixed: leverage has rebuilt, yet some positions were trimmed on the dip.
Pepe Whale Concentration: Who Holds the Supply?
On-chain holder analytics show a top 100 concentration at 76.78%, while 665 whale wallets, just 0.11% of holders, account for 89.99% of market cap.
Eighteen holders own at least 1% each. 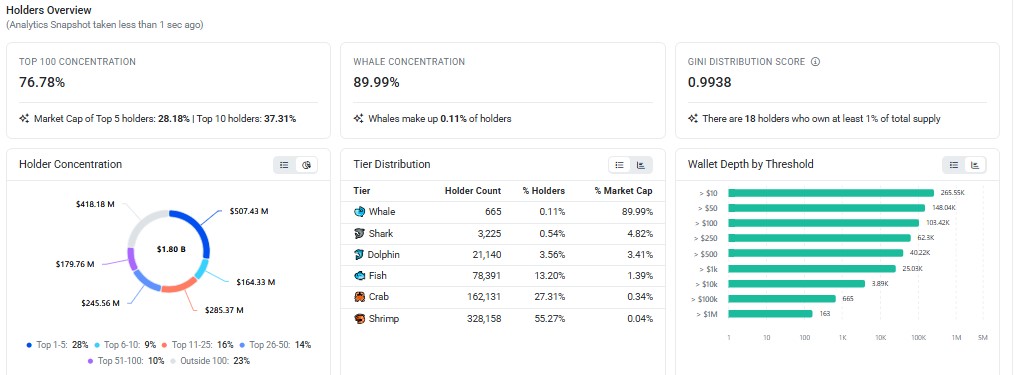
This whale concentration cuts both ways: accumulation can fuel a meme coin rally, but one large exit can crack support.
Is PEPE Dead? Sentiment on X
An X post by Rodney (@cryptojourneyrs) says $PEPE is not dead, a sign some traders still back the token. 
It is chatter, not a verified catalyst, so price must do the confirming.
PEPE Weekly Chart Analysis: Falling Wedge Near Resistance
Per TradingView chart data on the weekly timeframe, PEPE spent months squeezing inside a falling wedge, with lower highs and lower lows draining momentum.
Price recently pushed above the upper wedge line, a falling wedge breakout bulls had been waiting for. 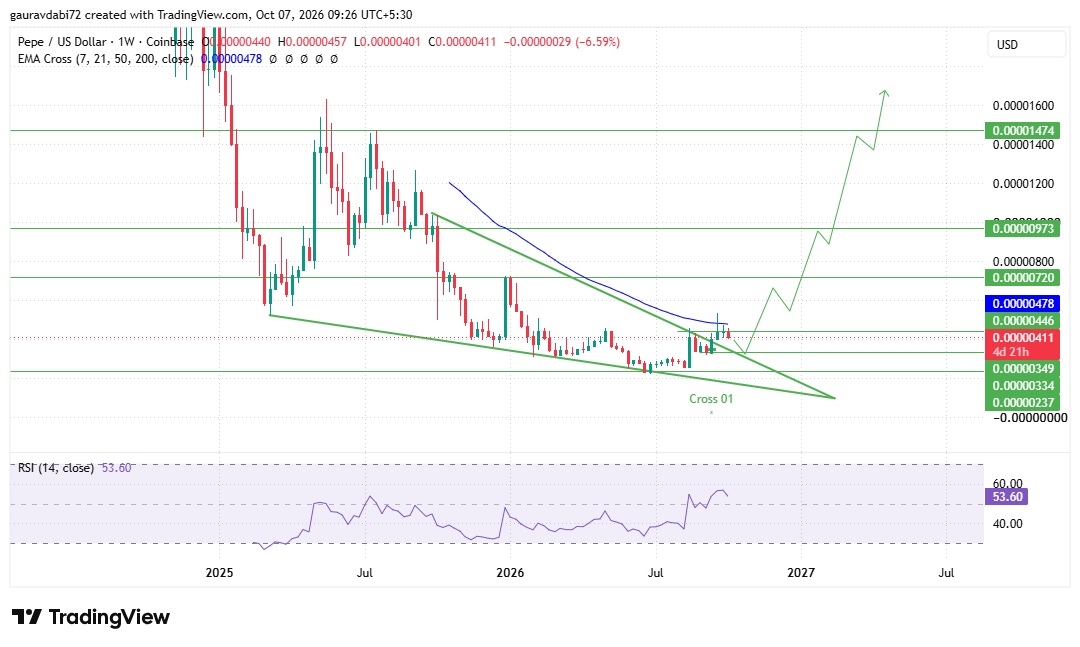
The follow-through is the problem. The latest weekly candle opened at 0.00000440, tagged 0.00000457, and closed near 0.00000411, a 6.59% drop after stalling below the EMA around 0.00000478.
Price is back on the wedge boundary, and this retest decides whether the move was real. The level to watch is 0.00000446, the key resistance zone.
A weekly close above it, held on a retest, would open 0.00000720, then 0.00000973 and the wider 0.00001474 area.
On the downside, 0.00000349 is first support, with 0.00000237 as deeper support.
RSI at 53.60 sits in neutral territory and is rising off its lows, so momentum is recovering without looking stretched.
Pepe Price Prediction 2029: Forecast Levels and Scenarios
In the base case, the Pepe price forecast is a range between 0.00000349 and 0.00000446 while buyers rebuild strength.
In the bull case, a hold above 0.00000446 turns the breakout into a trend and opens the higher levels step by step.
In the bear case, a weekly close below 0.00000349 would expose 0.00000237. Confirmation matters more than the pattern itself.
For an earlier outlook, check out our Pepe Price Prediction 2028 and see how PEPE’s key levels and market trend have evolved.
Key Risks for PEPE
A failed retest would turn the breakout into a trap. Futures-heavy trading can unwind fast, and whale-heavy ownership means a single exit can move the market.
Meme coins also tend to follow broader risk appetite and Bitcoin direction.
Expert Opinion on PEPE
As per the analyst desk, the wedge exit is constructive but unproven. Rising open interest shows traders are positioning again, yet the rejection near the EMA says buyers need a stronger weekly close.
Conclusion
Holding above 0.00000349 keeps the recovery structure alive, while a clean break and hold above 0.00000446 would strengthen the case for the higher levels in this outlook.
Disclaimer: This article is for informational purposes only and is not financial advice. Cryptocurrency is volatile, so always do your own research before making any decision.