Can a meme coin that has spent most of two years under pressure turn into a life-changing trade? This Pepe Price Prediction 2030 looks at a monthly chart that recently pushed out of a long compression, a holder base dominated by a few wallets, and leverage that is cooling.
Buyers have shown their hand once, yet they are being tested again.
The next stretch depends on a few levels and on how much belief the market still has in memes.
Pepe Price Today: Market Cap, Volume and Supply Data
PEPE trades near $0.000003932, down 2.89% over 24 hours, per Coinglass. Market cap is $1.62B, and circulating supply stands at 413.77T tokens, matching the maximum supply. 
Futures volume of $421.99M is about 4.6 times spot volume of $91.47M, so derivatives traders are setting the pace. 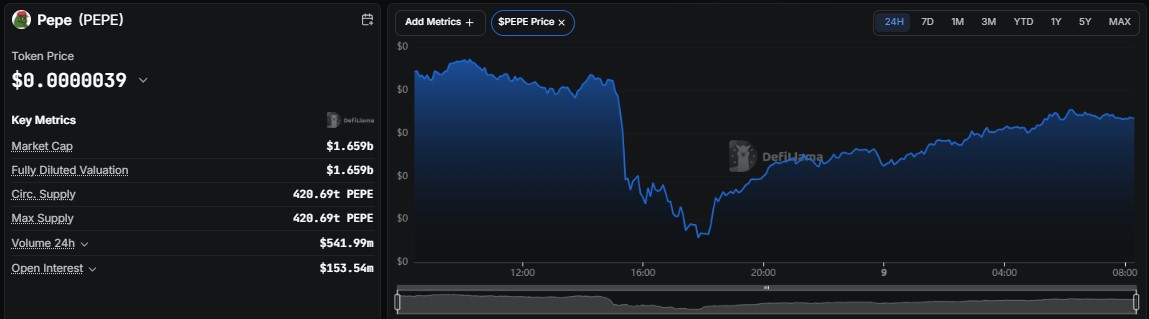
DefiLlama lists 24-hour volume at $541.99M, and its 24-hour chart shows a sharp slide on 8 October followed by a steady recovery.
PEPE Whale Holdings: Who Controls the Supply?
Holder data from Etherscan shows supply is tightly held. The top 100 wallets hold 76.57%, the top five account for 28.11%, and 17 holders own at least 1% each. 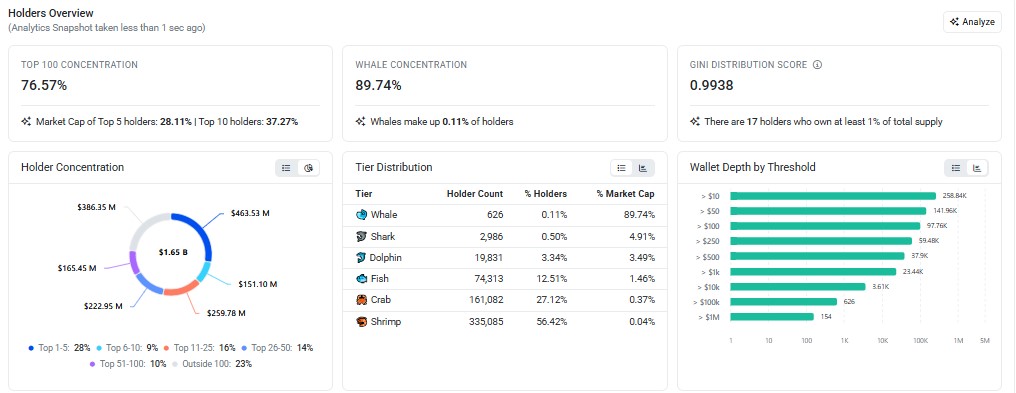
Just 626 whale wallets, or 0.11% of holders, control 89.74% of the supply, while 335,085 shrimp wallets make up 56.42% of holders and own 0.04%.
These PEPE whale holdings cut both ways. A single large exit could overwhelm demand, but steady whale accumulation would move a $1.62B market quickly.
Pepe Open Interest: Is Leverage Unwinding?
According to Coinglass, Pepe open interest is $281.62M. It jumped above $350M in late August and peaked near $400M in late September, then slid as the price rolled over.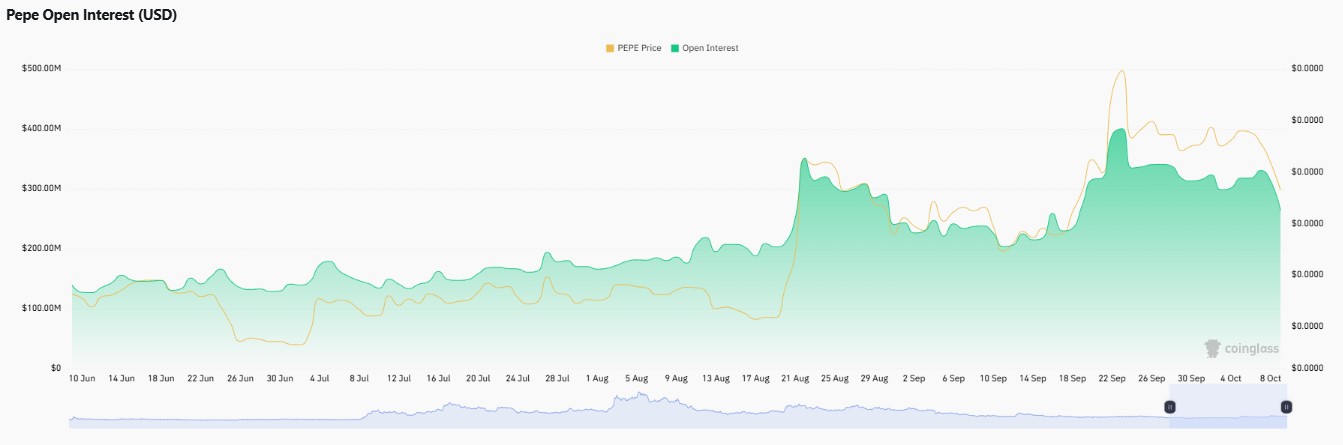 Open interest falling with price suggests traders are closing positions instead of doubling down, which clears excess leverage but also shows conviction is thin.
A recovery in open interest alongside rising prices would signal fresh buyers returning.
Memecoin Flip Bitcoin Claim: Does It Matter for PEPE?
An X post by fabiano.Sol relays a claim from Murad that a memecoin will flip Bitcoin and the entire US stock market. 
It is a bold opinion, not a PEPE-specific development, so it works as a sentiment signal rather than a hard catalyst.
Meme assets react to narrative, and statements like this can lift attention across the sector, but without fresh volume and rising open interest the effect can fade quickly.
PEPE Price Analysis: Monthly Falling Wedge Breakout and Retest
The monthly chart on TradingView shows PEPE pushing out of a falling wedge breakout after months of lower highs and shallow lows from the early 2025 peak. 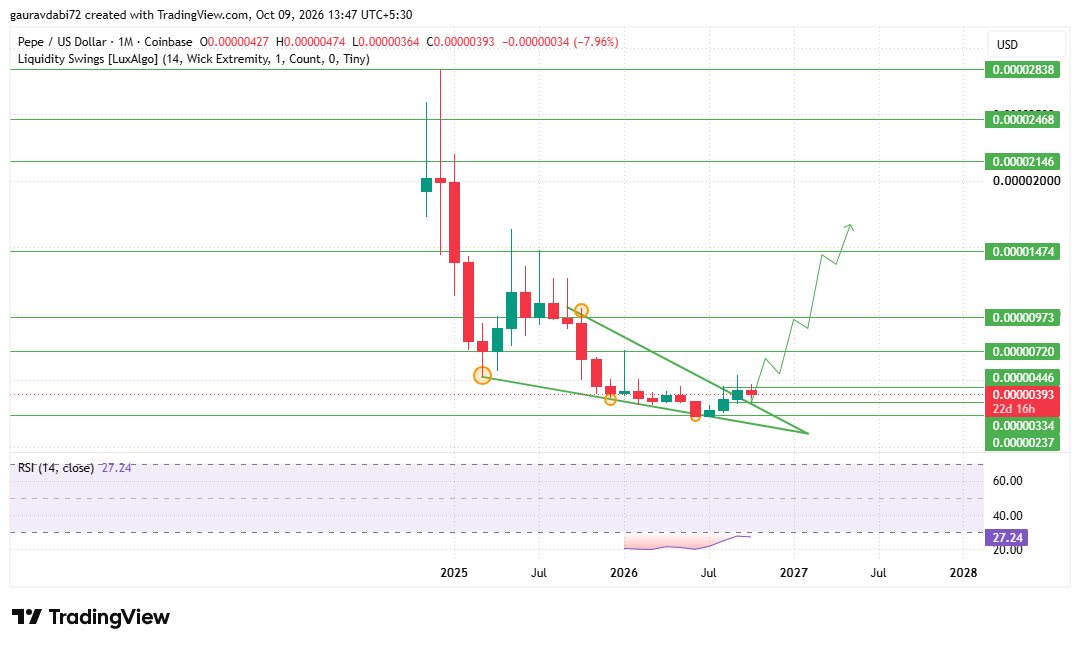
Summer candles closed above the wedge's upper edge, and the current red monthly candle, down 7.96%, looks like a retest of that area.
RSI at 27.24 sits deep in oversold territory, so momentum has been battered but is still trying to turn. A monthly close back inside the wedge would weaken the case.
Overhead, the chart marks 0.00000446 first, then 0.00000720, the level that decides whether the breakout becomes a trend.
Clearing it, about 83% above price, would confirm a bullish structure and open 0.00000973, 0.00001474, 0.00002146, 0.00002468 and 0.00002838.
Many of these levels cluster in the supply zone left by the 2025 sell-off.
On the downside, 0.00000334 is first support, about 15% below, with 0.00000237 roughly 40% lower.
Can PEPE Make Millionaires? What the Numbers Say
The highest level on the chart, 0.00002838, is about 7.2 times the current price and would imply a market cap near $11.7B at 413.77T supply, against $1.62B now.
A $1,000 stake would grow to roughly $7,200 there. True millionaire outcomes need far more.
A 100x from here puts the market cap near $162B and 1,000x near $1.62T. That is why our Pepe forecast treats the chart levels as realistic zones and anything beyond as a distant stretch case.
Position size, entry price, and timing matter far more than the headline.
PEPE Outlook: Base, Bull and Bear Cases
The Pepe Price Prediction 2030 outlook hinges on 0.00000720. In the base case, PEPE holds above 0.00000334 and ranges while RSI recovers from oversold.
The bull case needs a monthly close above 0.00000720, which would open 0.00000973 and then 0.00001474.
The bear case is a monthly close below 0.00000334, which would put 0.00000237 in play and damage the breakout. These PEPE support and resistance levels frame every scenario.
For an earlier outlook, check out our Pepe Price Prediction 2029 and see how PEPE’s key levels and market trend have evolved.
Key Risks for PEPE Holders
A handful of whale wallets controls most of the supply, so distribution is the obvious tail risk.
A monthly close back inside the wedge would undo the breakout, and futures volume running at roughly 4.6 times spot can exaggerate moves either way.
Oversold RSI can also stay depressed for a long time, and narrative-driven attention fades quickly.
Expert Opinion: How Does the Analyst Desk Read PEPE?
As per the analyst desk, the breakout is real but unproven. The retest is healthy so long as 0.00000334 holds, and cooling leverage has removed some froth.
The desk wants a monthly close above 0.00000720 and rising open interest before calling the trend changed. Until then, patience matters more than conviction.
Conclusion
The Pepe Price Prediction 2030 outlook rests on a wedge breakout that now needs to hold.
Defending 0.00000334 keeps the path toward 0.00000720 alive, while a monthly close below it would shift focus to 0.00000237.
Millionaire headlines make good clicks, but the numbers say only a few chart levels are realistic.
Disclaimer: This article is for informational and educational purposes only and does not constitute financial, investment or trading advice. Cryptocurrency prices are highly volatile, and readers should do their own analysis and consider their risk tolerance before making any decision.