Can DOT reach $20 in the years ahead?
The Polkadot price prediction 2029 debate has picked up as the monthly chart hints at a turn after a long term downtrend, though buyers still have to prove it.
Here is how the Polkadot forecast shapes up.
$DOT Market Cap, Supply and Funding Data
According to DefiLlama data, DOT trades near $1.12 with a market cap and fully diluted valuation both at $1.914 billion. 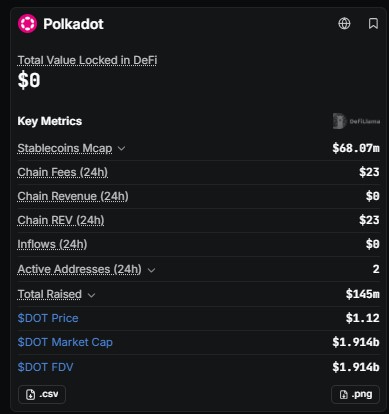
The stablecoin market cap stands at $68.07 million and total funds raised at $145 million.
The DeFi footprint is thin: TVL reads $0, 24-hour chain fees are $23, and active addresses number 2.
CoinGlass lists 1.70 billion DOT circulating against a 2.10 billion max supply.
Polkadot Network Activity on Subscan
Per Subscan, the network has finalized 33,322,643 blocks and processed 42,388,929 signed extrinsics, with 39,664,551 transfers across 67,982,828 total accounts. 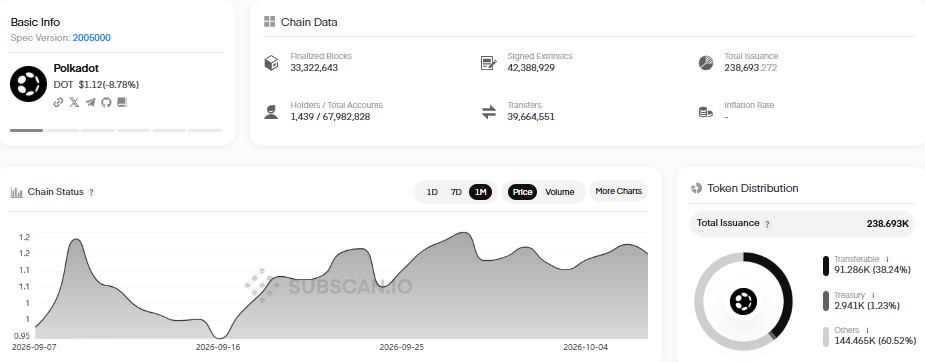
Lifetime usage looks heavy against DefiLlama's near-zero daily readings, so on-chain activity has to improve for the recovery to feel supported.
DOT Open Interest: Are Traders Returning?
Per Coinglass, DOT open interest was $239.22 million on 7 October with a price near $1.21.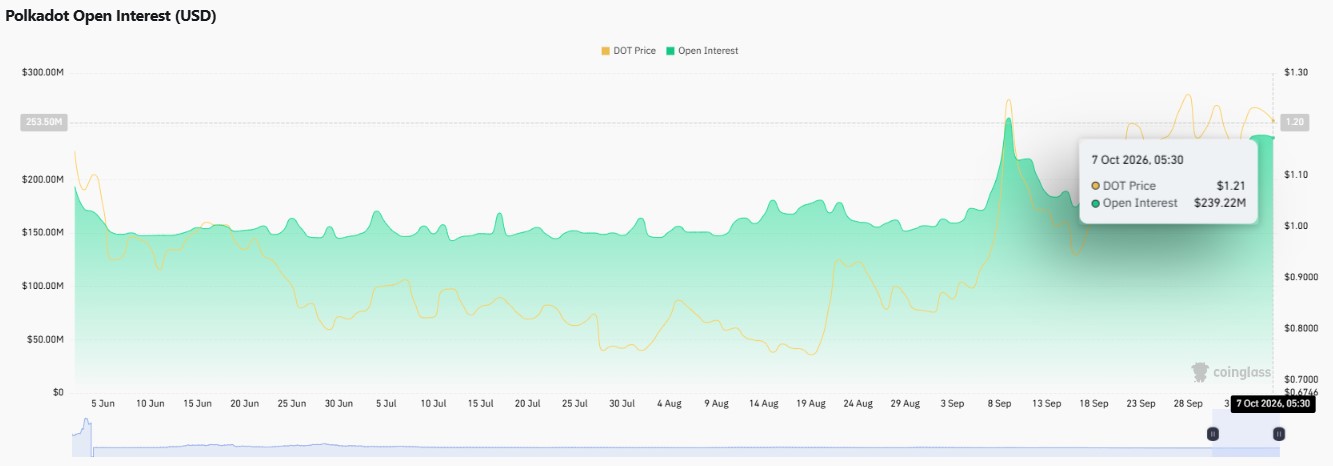
The header now shows $227.77 million as the price fell 8.74% to $1.1218. Open interest hovered near $150 million through June, July, and August, then jumped toward $255 million around 8 September as price rebounded from its lows.
Futures volume of $259.36 million against spot volume of $47.34 million shows leveraged traders are back, but the cooling on this dip keeps the read mixed.
DOT Monthly Chart Analysis: Falling Wedge Breakout
Per TradingView chart data on the Coinbase monthly timeframe, DOT has been squeezed inside a monthly falling wedge since early 2025, with lower highs and lower lows draining momentum.
Price found support at 0.7471, the key support zone, then pushed above the upper wedge line, a breakout that took close to two years to form. 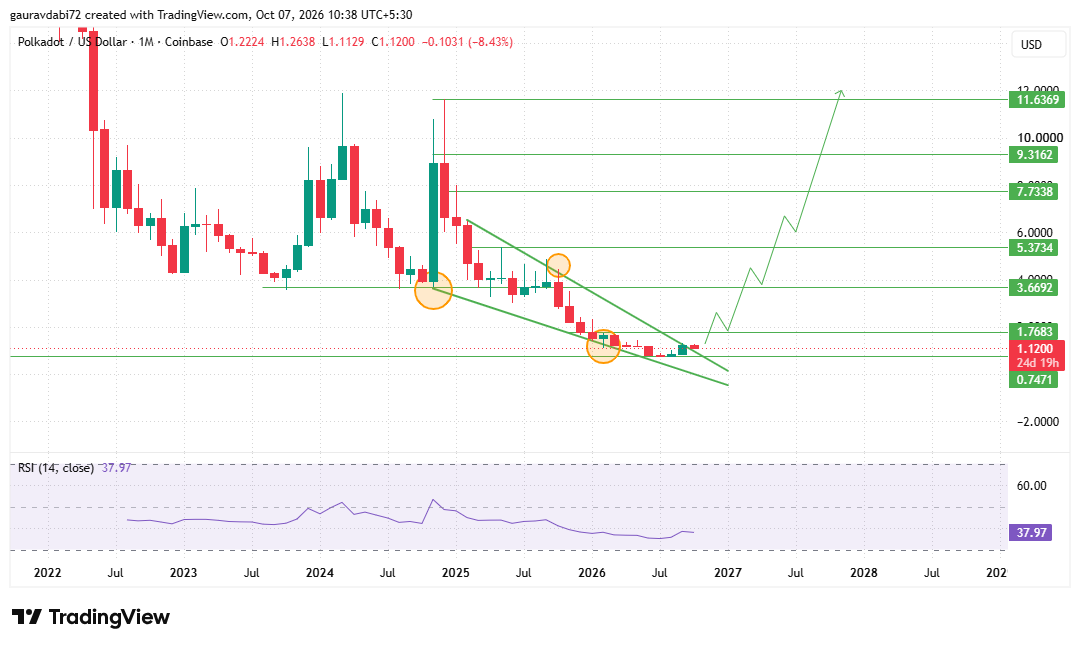
The October candle is the test. It opened at 1.2224, reached 1.2638, and trades near 1.1200, down 8.43% with about 24 days left, so the price is retesting the wedge boundary.
Resistance starts at 1.7683. A monthly close above it, held on a retest, would open 3.6692, then 5.3734, 9.3162, and the wider 11.6369 area.
If buyers fail, 0.7471 is the support that must hold. RSI at 37.97 is lifting off its lows but still sits below the neutral line, so momentum has not confirmed yet.
Polkadot Price Prediction 2029: Forecast Levels and Scenarios
In the base case, the Polkadot price forecast is a wide range between 0.7471 and 1.7683, while the breakout is tested.
In the bull case, a monthly close above 1.7683 turns the wedge exit into a trend and opens the higher levels in steps.
In the bear case, a break below 0.7471 would undo the breakout. Confirmation matters more than the pattern.
So, can DOT reach $20? The chart does not map a level that high.
The highest zone sits at 11.6369, so $20 would need a clean run through 1.7683, 3.6692, 5.3734 and 9.3162 first, followed by a monthly hold above 11.6369. That is a stretch scenario, not the base case.
For an earlier outlook, check out our Polkadot Price Prediction 2028 and see how DOT’s key levels and market trend have evolved.
Key Risks for DOT
A failed retest would turn the breakout into a trap.
Thin DeFi activity limits organic demand, and futures-heavy trading can unwind fast when spot volume stays small. Broader risk appetite and Bitcoin direction also matter.
Expert Opinion on DOT
As per the analyst desk, the wedge exit is a constructive long-term signal, but one monthly candle does not make a trend.
The distance from 1.1200 to 1.7683 is wide, and RSI below 40 says buyers still need stronger follow-through.
Conclusion
Holding above 0.7471 keeps the recovery structure intact, while a monthly close and hold above 1.7683 would strengthen the case for the higher levels in this outlook.
Disclaimer: This article is for informational purposes only and is not financial advice. Cryptocurrency is volatile, so always do your own research before making any decision.