Can SUI really aim for $10? The Sui price prediction 2029 debate has returned, as the monthly chart shows a possible turn after a long slide from its highs, though the bigger levels are still far away.
Here is how the Sui forecast looks right now.
SUI Market Cap, TVL and Chain Metrics
According to Coinglass, SUI trades near $1.14 with a market cap of $4.685 billion against a fully diluted valuation of $11.376 billion.
DeFi TVL stands at $538.27 million, down 3.63% over 24 hours. Active addresses reached 157,689, with 24-hour chain fees at $7,500.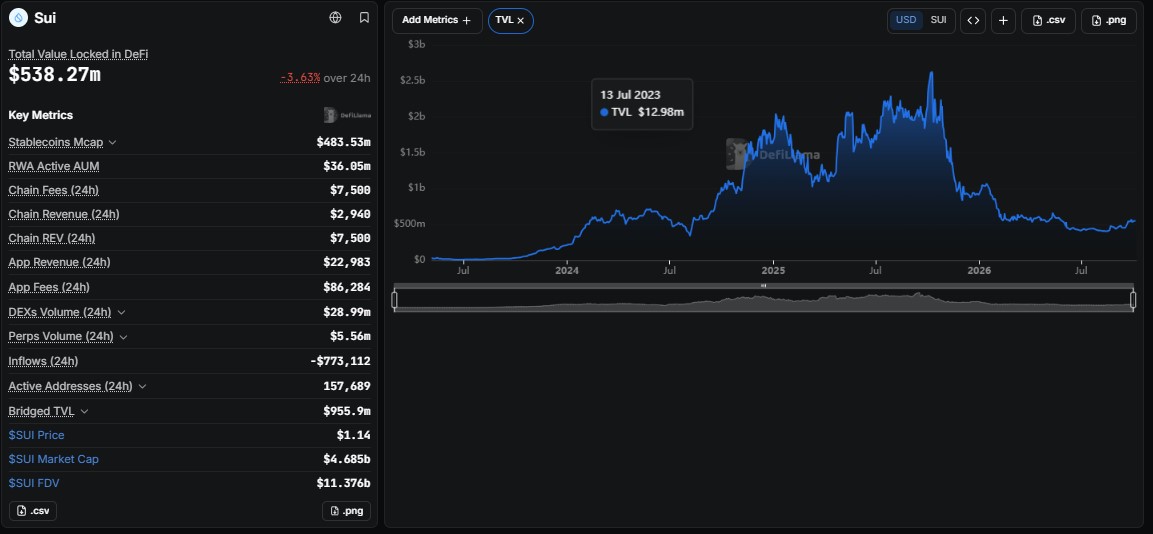
Sui Network Activity on SuiVision
Per SuiVision, the network counts 16.94 billion total transactions across 230.32 million accounts, with 7.07 billion SUI staked across 127 validators at a 1.48% staking APY. 
Usage is deep, yet only 41.18% of the 10 billion supply is circulating, so future issuance stays a long-term overhang.
SUI Open Interest: Is Leverage Running Hot?
Per Coinglass, open interest was $966.54 million on 7 October with a price near $1.18, and the header now shows $939.78 million as SUI slipped 3.89% to $1.1442. 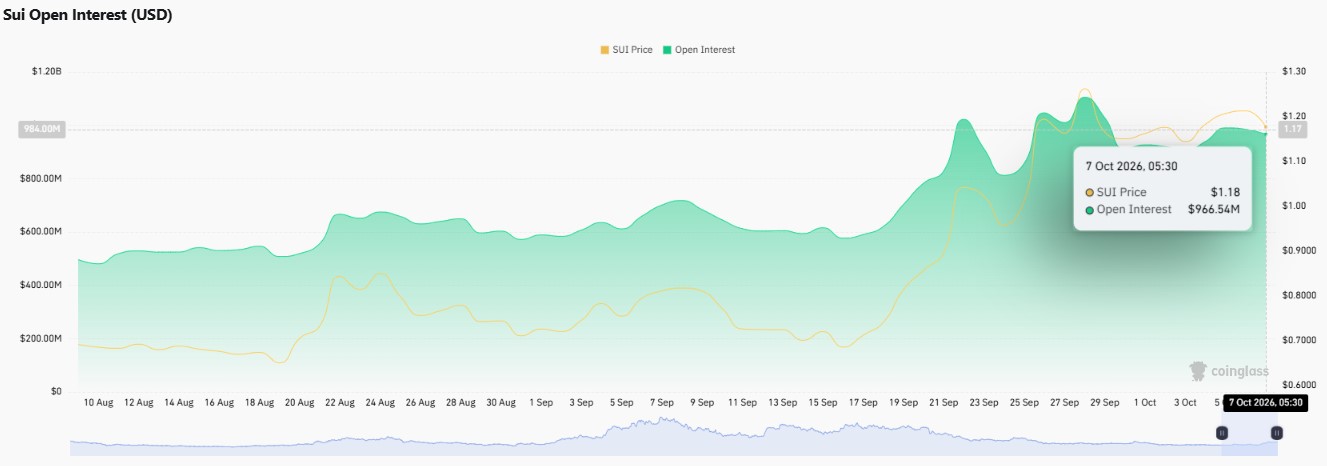
The open interest surge is the bigger story: it grew from roughly $500 million in mid-August to above $1 billion in late September as price rose from the $0.70s to above $1.20.
Futures volume of $1.01 billion dwarfs spot volume of $213.51 million.
SUI News: AI Security Tool Draws Attention
An X post by Kyle Chassé says Sui's Adeniyi Abiodun demoed an AI tool watching over $450 million in smart contracts, scanning 450+ packages in real time. 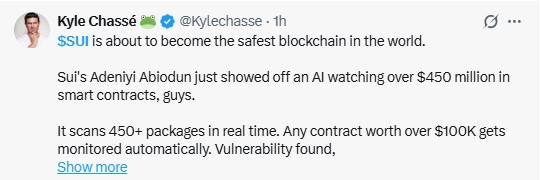
If accurate, stronger smart contract security could support developer confidence, but it is one account's claim, and the price still has to be confirmed.
SUI Monthly Chart Analysis: Falling Wedge Breakout
Per TradingView chart data on the monthly timeframe, SUI slid from its early 2025 peak near 5.3532 into a falling wedge, printing lower highs and lower lows through 2026. 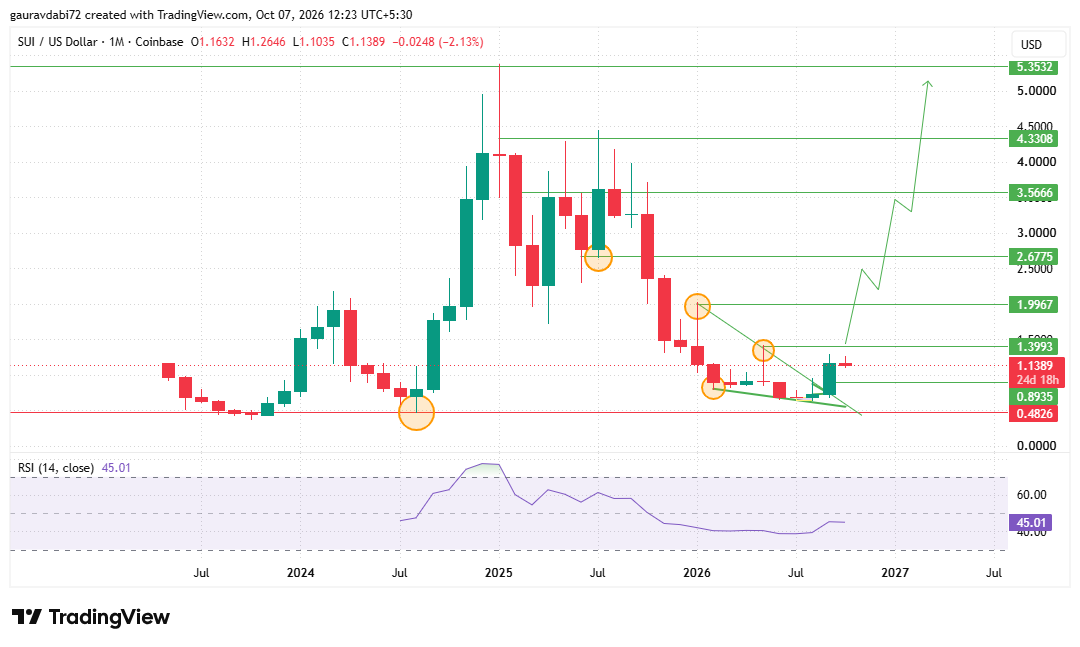
Support held at 0.8935, and a strong September candle pushed price through the upper wedge line.
October has pulled back. It opened at 1.1632, reached 1.2646, and trades near 1.1389, down 2.13% with about 24 days left, so this is a breakout retest below resistance at 1.3993.
A monthly close above 1.3993, held on a retest, would open 1.9967, then 2.6775, 3.5666, 4.3308, and 5.3532. Below, 0.8935 is first support, with 0.4826 as major support.
RSI at 45.01 is lifting off its lows but still sits under the neutral line, so momentum is improving without confirming.
Sui Price Prediction 2029: Forecast Levels and Scenarios
In the base case, the Sui price forecast is a range between 0.8935 and 1.3993 while the breakout is tested.
In the bull case, a monthly close above 1.3993 turns the wedge exit into a trend and opens the higher levels in steps. In the bear case, a break below 0.8935 would expose 0.4826.
So, can SUI hit $10? The chart maps nothing above 5.3532. A monthly break and hold above that level would unlock the $10 zone, which makes it a stretch scenario, not the base case.
For an earlier outlook, check out our SUI Price Prediction 2028 and see how SUI’s key levels and market trend have evolved.
Key Risks for SUI
A failed retest would turn the breakout into a trap. Leverage near $1 billion can unwind fast, and the gap between market cap and fully diluted valuation points to future supply.
Expert Opinion on SUI
As per the analyst desk, the wedge exit is constructive, but one strong monthly candle does not make a trend. Rising leverage needs spot demand behind it, and RSI below 50 says buyers still have work to do.
Conclusion
Holding above 0.8935 keeps the recovery structure intact, while a monthly close and hold above 1.3993 would strengthen the case for the higher levels in this outlook.
Disclaimer: This article is for informational purposes only and is not financial advice. Cryptocurrency is volatile, so always do your own research before making any decision.