

Can a blockchain built for speed turn headline records into a price that still matters in 2040?
The SUI price prediction 2040 debate is heating up as the weekly chart tightens and the network keeps adding real distribution.
Traders want to know whether this coil is the start of a bigger cycle or another pause before more selling.
Sui Price Today: Market Stats Behind the 2040 Outlook
Data as of 15 October 2026. Sui trades near $1, down 5.44% over 24 hours, per DefiLlama data. 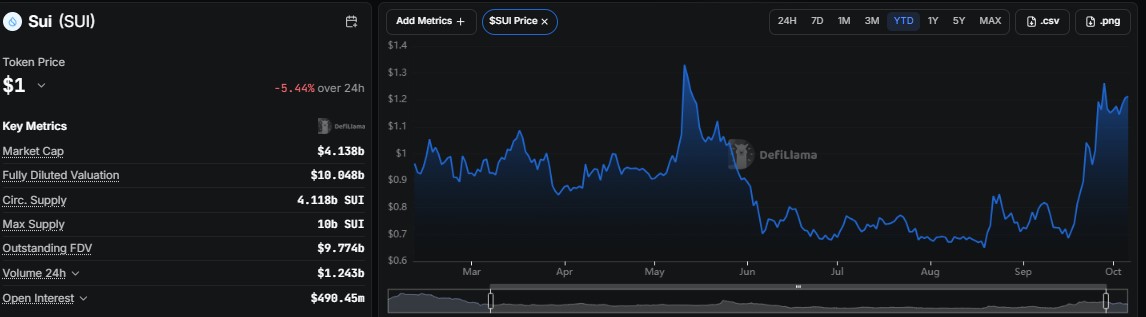
Market cap is $4.138 billion, and fully diluted valuation is $10.048 billion, with 4.118 billion SUI circulating against a 10 billion max supply.
Outstanding FDV is $9.774 billion, and 24-hour volume is $1.243 billion.
The year-to-date chart shows a spike toward $1.30 in May, a long slide into a $0.65 low in August, and a sharp recovery from September.
This SUI price analysis starts from a market that has bounced hard but is now giving some of it back.
SUI Open Interest: Leverage Unwinds From the September Peak
Per Coinglass, SUI open interest is near $750 million. It sat in a $450 million to $550 million base through July and August, then climbed to about $1.1 billion in late September as prices pushed above $1.20.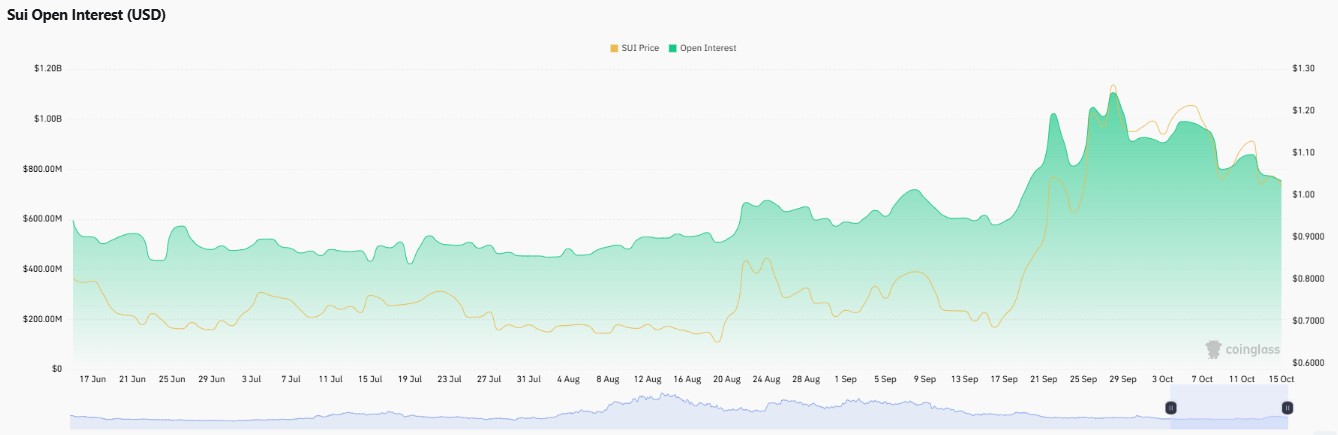
Since then it has cooled steadily alongside the price. That unwind is healthy in one sense, since fewer overleveraged positions means less forced selling, but it also shows speculative appetite is fading from the peak.
For any Sui forecast, the next few weekly closes carry extra weight.
Samsung Wallet Brings Sui to 82 Million US Galaxy Devices
A post from the official Sui Network account on X recaps an earlier announcement that Sui support is being built into Samsung Wallet on 82 million Galaxy devices in the US. USDC on Sui would move with zero network fees.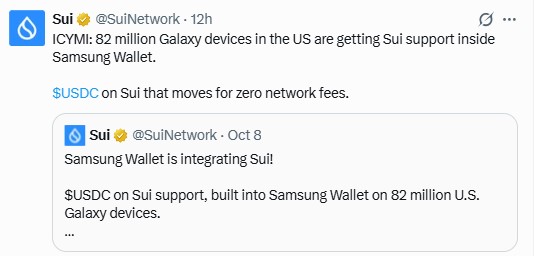
Distribution at that scale is rare for a layer one. Integration alone does not create demand, but it gives the network a real consumer path to test.
Sui Reportedly Hits 40.6 Million TPS, and AI Agents Are the Argument
An X post by Kyle Chassé says Sui processed 40,614,180 transactions per second, verified live by CertiK at Sui Basecamp. 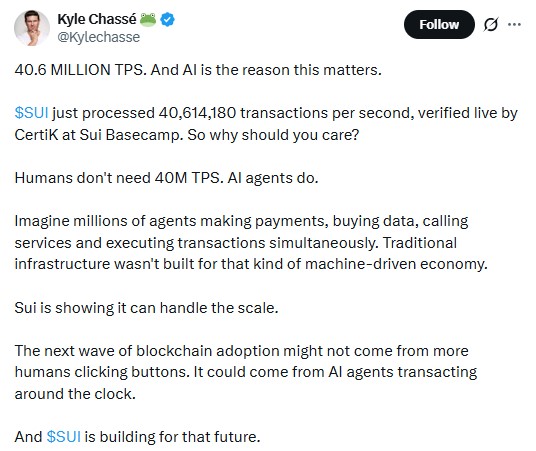
His argument is that humans do not need that speed, but AI agents making payments and calling services around the clock do.
It is a test result and an opinion about where adoption could come from, not live mainnet demand. Still, it gives the long-range story a clear identity.
Sui Weekly Chart: Symmetrical Triangle
Per TradingView weekly chart data, SUI is squeezing inside a symmetrical triangle.
A falling trendline from the January high is meeting a rising line drawn from the August low, and the space between them keeps shrinking.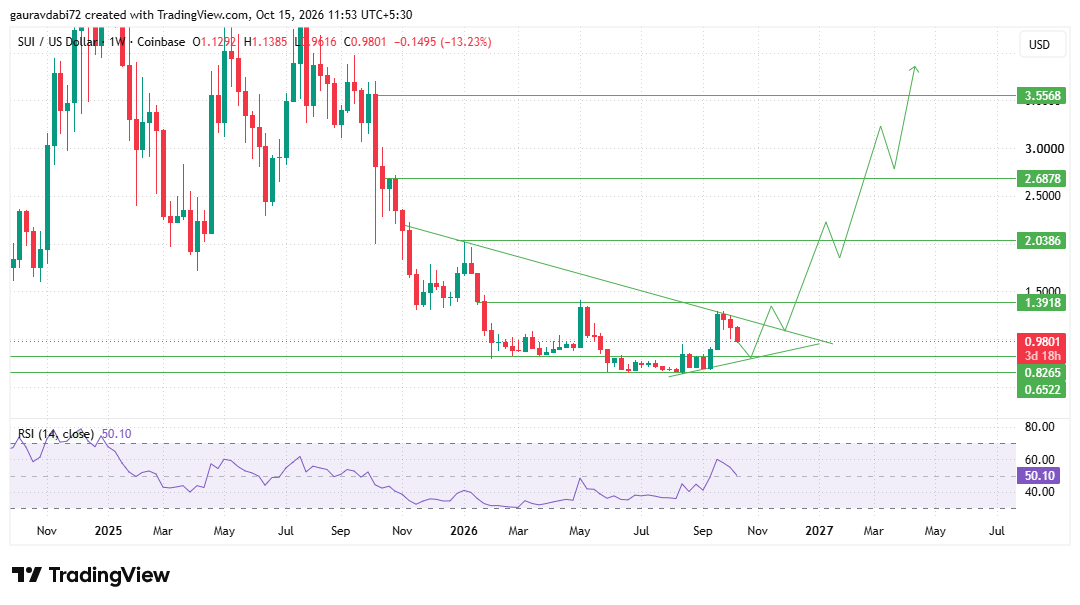
Last week the price ran into the falling line and reversed, leaving a red weekly candle down roughly 13%, near 0.98.
A rejection at a triangle edge is common, so the real question is whether buyers defend the rising line near the 0.9 zone and make another try.
A weekly close above 1.3918 that holds would be a real breakout signal, since it clears both the falling line and the horizontal ceiling.
From there, 2.0386 is the next resistance, then 2.6878, with 3.5568 as the highest chart level.
On the downside, 0.8265 is the first support, and a loss there would expose 0.6522, the low that started the recovery.
RSI at 50.10 sits right at the midpoint, so momentum is balanced and not yet decisive.
For an earlier outlook, check our SUI Price Prediction 2035 and see how SUI's key levels and market trend have evolved.
Sui Network Activity and Staking on SuiVision
SuiVision data shows 17.2 billion total transactions and 230.38 million total accounts. Some 7.07 billion SUI is staked across 125 validators, about 71% of the 10 billion total supply, with a staking APY of 1.32%. Epoch 1,281 is under way, and the average gas fee is 0.00047 SUI.
Heavy staking keeps a large share of supply out of the market, a quiet positive for the Sui forecast, though the low yield means it is not a strong incentive on its own.
Can SUI Break Above $100? What the Math Requires
Start with the numbers. From $0.98, $100 is roughly a 100x move. Today's 4.118 billion circulating supply implies a market cap near $412 billion, or about $1 trillion on the full 10 billion max supply, against $4.138 billion now.
The base case for this SUI price prediction 2040 is a slow range between 0.8265 and 1.3918 while the triangle resolves.
The bull case needs a weekly close above 1.3918 that holds, then a step-by-step climb through 2.0386 and 2.6878.
The bear case is a weekly close below 0.8265, which puts 0.6522 back in play.
The highest chart level of 3.5568 is about 3.6x from here and would imply a market cap near $14.6 billion on circulating supply.
Anything beyond that rests on years of adoption nobody can verify today, which makes $100 a stretch within any Sui forecast.
Key Risks for SUI's Long-Range Outlook
A firm rejection at the falling trendline could trap price inside the triangle for months. A weekly close below the rising line would unwind recent gains quickly.
Token unlocks can add supply pressure, since the fully diluted valuation is more than double the market cap, and Bitcoin correlation still guides altcoins. Speed tests also do not guarantee live demand.
Analyst Desk View on Sui
As per the analyst desk, SUI is at a decision point rather than in a trend. The rejection from the falling trendline is a normal triangle reaction, and the Samsung Wallet and AI agent narratives give the story substance.
Yet the price is still well below 1.3918, and cooling open interest shows speculative interest is easing.
A weekly close above that level would be the first clean signal that the Sui forecast is strengthening.
Conclusion
The SUI price prediction 2040 starts from a neutral and unresolved position. A tightening triangle, real distribution through Samsung Wallet, and heavy staking support the bullish case, while cooling leverage and the 1.3918 ceiling keep it honest.
Until a weekly close above that level holds, caution is advised. Market data in this article was last updated on 15 October 2026.
Disclaimer: This article is for informational and educational purposes only and is not financial advice. Cryptocurrency prices are highly volatile, and long-term price predictions are speculative.





