Can TRX build on a climb that has lasted for years, or is the market running short of fresh buyers?
The token keeps printing higher lows while sitting just under a ceiling it has so far failed to clear, and that tension drives the TRON price prediction 2027 conversation.
Traders now want to know whether patient accumulation can turn into a bigger leg higher, or whether the range simply keeps repeating.
TRX Price Today: Market Cap, Supply and Valuation
TRX price today is near $0.335, down 0.13% over 24 hours, according to Coinglass. 
Market capitalization is about $31.83 billion, and almost the entire 94.98 billion supply is already in circulation, per Tronscan. 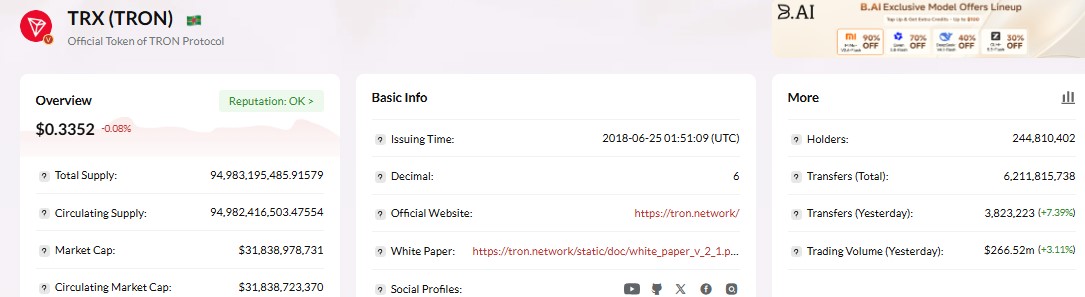
DefiLlama lists the fully diluted valuation at $31.887 billion, nearly level with market cap, so dilution is not the issue here.
Any move higher has to come from demand. Tronscan also shows $266.52 million in trading volume yesterday, up 3.11%.
Tron TVL and Network Activity: How Healthy Is the Chain?
DefiLlama puts Tron TVL at $5.706 billion, up 0.71% in 24 hours. That is well below the roughly $8 billion seen in early 2025, but it has climbed back from a low near $4 billion in early 2026. 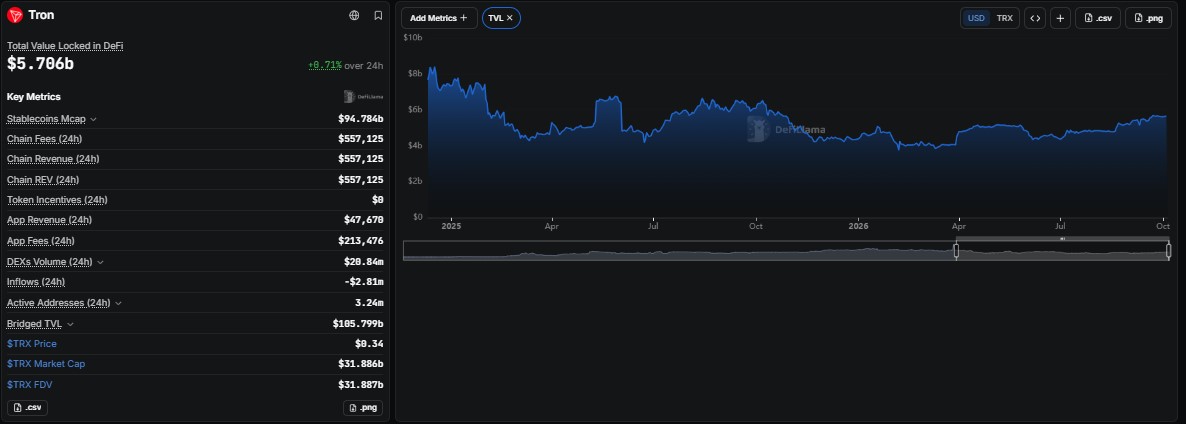
Tron stablecoin supply is the anchor at $94.784 billion, with 3.24 million active addresses in the last 24 hours.
Chain fees were $557,125 against app fees of $213,476, DEX volume was a modest $20.84 million, and net flows were negative at $2.81 million, so capital is not yet pouring in.
Tronscan adds scale: 244.81 million holders, 6.21 billion total transfers, and 3.82 million transfers yesterday, up 7.39%.
That steady Tron network activity suggests usage leans on stablecoin transfers far more than DEX trading, given how small DEX volume is next to stablecoin supply.
Tron Open Interest: Is Leverage Building?
Open interest is $343.22 million per Coinglass, only about 1% of market cap, which is a light leverage footprint for an asset this size.
Futures volume of $92.55 million is roughly 3.4 times the $26.99 million traded on the spot.
The structure looks driven more by holders than by leveraged bets, though derivatives still dominate daily turnover, so the read stays mixed.
Spot TRX ETF: A Quiet Start for a Demand Channel
An X post from BSCN citing SoSoValue says Canary's TRX spot ETF has seen just one active day since its September 10 launch, with $491K in net inflows on September 15 and $0 in flows every day after. 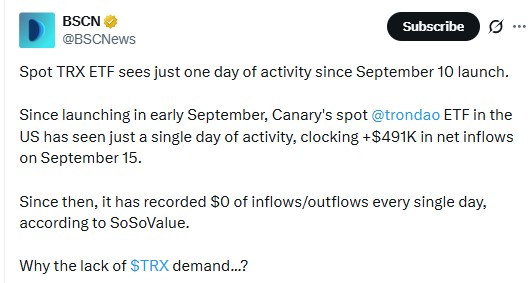 Missing ETF demand removes a possible bullish catalyst, though it is not selling pressure in itself. If inflows wake up, it would be the first sign of institutional appetite.
TRX Monthly Chart Analysis: Ascending Trendline and Higher Lows
Our TRX technical analysis on the TradingView monthly chart shows the price respecting a Tron ascending trendline that rose off the 2023 base. 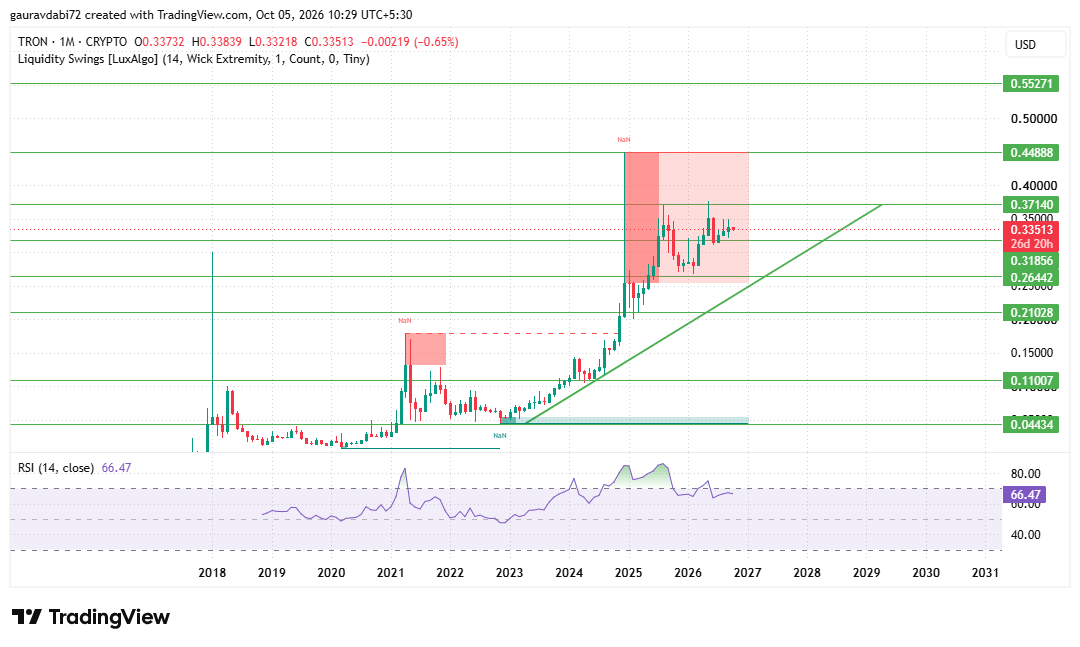
Each major pullback since has held above a higher floor, which is the mark of a healthy trend.
After the sharp spike toward 0.44888 around the turn of 2025, price has moved sideways inside the shaded supply block, with 0.26442 holding the lows and 0.37140 capping the highs.
The current monthly candle opened at 0.33732 and trades at 0.33513, down 0.65%, so the market is catching its breath. Monthly RSI at 66.47 shows strong but not exhausted momentum.
For the TRON price prediction 2027 picture, the level to watch is 0.37140. A monthly close above it would open the way to 0.44888, and a break there brings 0.55271 into play.
These are the TRX support and resistance levels that matter on the upside. On the downside, 0.31856 is immediate support, then 0.26442 at the base of the recent range.
Losing that would put the rising trendline, which runs near 0.21028, under test, with 0.11007 and 0.04434 as deeper levels.
What Needs to Change for TRX to Reach $1?
The arithmetic is demanding. At roughly three times the current price, $1 would imply a market cap near $95 billion on today's supply, and the chart has no mapped level between 0.55271 and $1, so that zone is price-discovery territory.
Getting there needs a monthly close above 0.37140, Tron TVL rebuilding toward the $8 billion seen in early 2025, net flows turning positive, ETF flows finally registering, and spot volume growing against futures.
Even if every box ticks, 0.55271 comes first, and it sits about 65% above the current price.
TRX Price Outlook 2027: Scenarios and Key Levels
These are scenario zones drawn from chart structure over the 2027 horizon, not dated forecasts.
In the TRON price prediction 2027 base case, the market grinds inside the range before a decisive monthly close picks a direction. As long as higher lows hold, the bias remains constructive.
Key Risks for TRX
The token has been range-bound for over a year, and a failed attempt at 0.37140 would extend that. ETF flows are flat, net flows are negative, and TVL is still well under its early 2025 level.
DEX activity is thin against the size of the chain, RSI near 66 leaves limited room before overbought readings, and $1 requires a roughly threefold move that no mapped level supports.
Expert Opinion on TRX's 2027 Outlook
As per the analyst desk, the trend is intact but unproven at higher levels. Higher lows and a deep stablecoin base give TRX a stronger foundation than most large caps, yet the market has not rewarded it with a breakout.
The desk wants a monthly close above 0.37140 backed by rising TVL before treating 0.44888 as the next real test and sees $1 as a stretch case rather than a base assumption.
Conclusion
The TRON price prediction 2027 outlook rests on whether TRX can turn a patient range into a monthly close above 0.37140.
Above it, 0.44888 and 0.55271 come into view. Below 0.26442, the trendline becomes the last line of defense.
Reaching $1 by 2027 is a stretch scenario that would need much stronger demand, rising TVL, and a real pickup in ETF flows.
Disclaimer: This article is for informational purposes only and does not constitute financial, investment, or trading advice. Cryptocurrency prices are volatile, and scenarios discussed here are not guarantees. Please do your own assessment before making any decision.