Can a token that has fallen so far finally build a lasting recovery? This Polkadot Price Prediction 2030 weighs a monthly chart that has just slipped out of a long squeeze, a network pushing a governance-led stablecoin and leverage that refuses to leave.
Buyers have taken a first step, but wide gaps remain overhead. What follows depends on whether support holds and whether the new narrative turns into real demand.
Polkadot Price Today: Market Cap, Volume, and Supply Data
DOT trades near $1.1795, up 7.06% over 24 hours, according to Coinglass. Market cap is $2.02B, with a circulating supply of 1.70B DOT against a 2.10B maximum. 
Futures volume of $385.38M is about 6.3 times spot volume of $61.07M, so derivatives dominate trading. 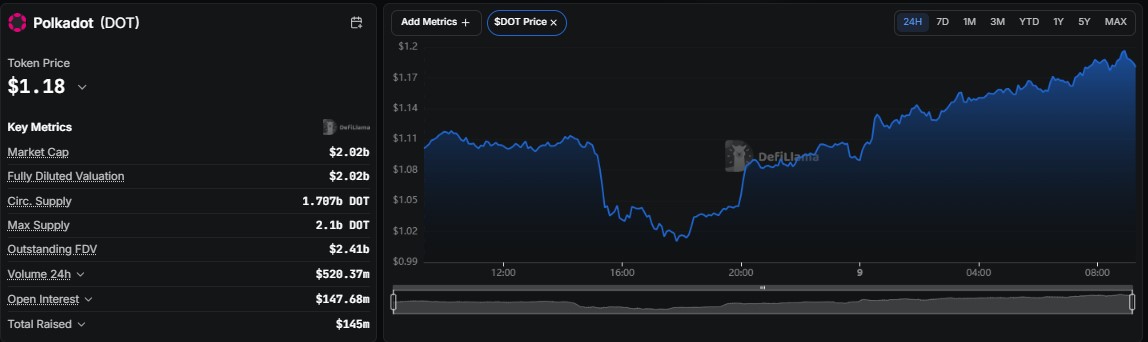
DefiLlama shows a 24-hour volume of $520.37M and an outstanding fully diluted valuation of $2.41B, and its 24-hour chart traces a dip to roughly $1.01 on 8 October, followed by a steady climb.
Polkadot Open Interest: Is Leverage Still Elevated?
Per CoinGlass, Polkadot open interest is $238.49M. It sat near $150M through the summer, jumped to about $255M in early September, and has held roughly between $200M and $240M since, even as the price slid back toward $1 before today's bounce. 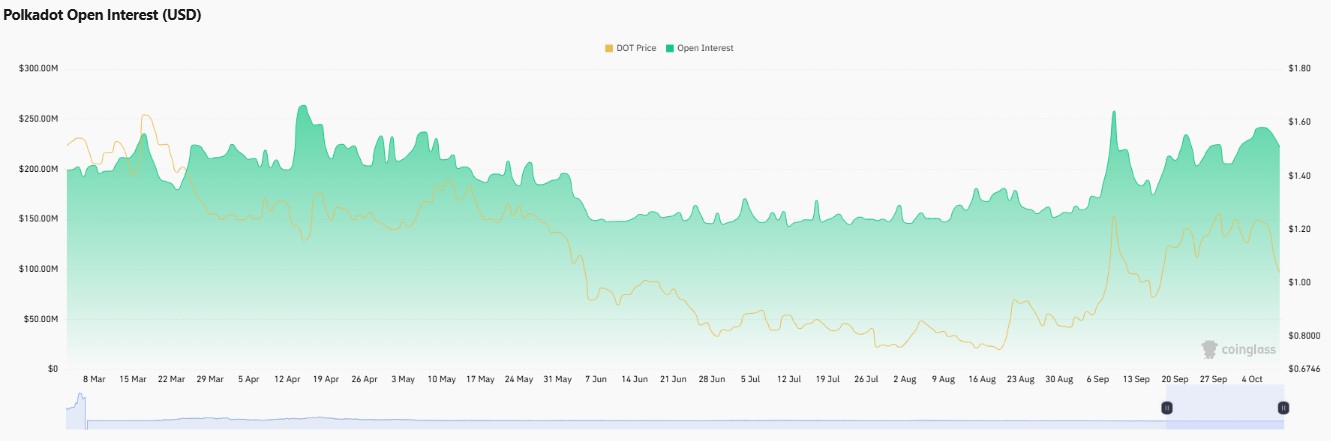
Leverage that stays high while price falls is a mixed signal, since it can mean trapped longs or building shorts.
A move through resistance with open interest holding steady would be the cleaner confirmation.
dotUSD Stablecoin Launch: What Does It Mean for DOT?
A post by Polkadot on X says dotUSD is live. It contrasts the product with a handful of companies that issue and control most of the world's stablecoins, worth more than $250B, and says dotUSD has no issuing company and no single point of control. 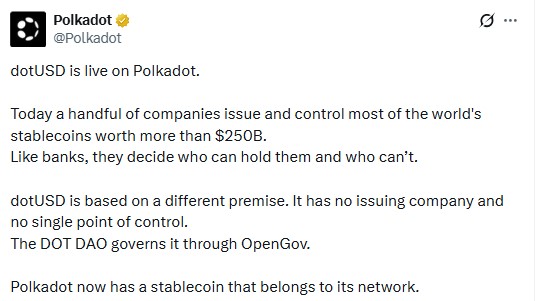
The DOT DAO governs it through OpenGov.
BSCN on X describes it as an immutable, decentralized dotUSD stablecoin deployed on mainnet and governed on-chain. 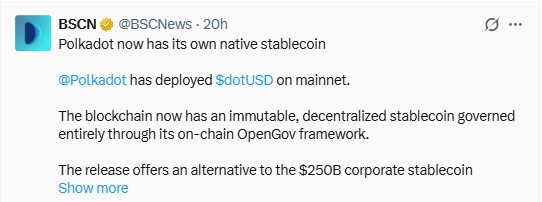
That gives the network a native use case and ties DOT holders to its governance.
Adoption will decide whether it matters, and the price is up 7.06% on the day, though one headline cannot explain the whole move.
Polkadot Network Activity: What Does On-Chain Data Show?
Data from Subscan shows 33,353,775 finalized blocks, 42,391,457 signed extrinsics, and 39,664,552 transfers, so the chain is far from idle. 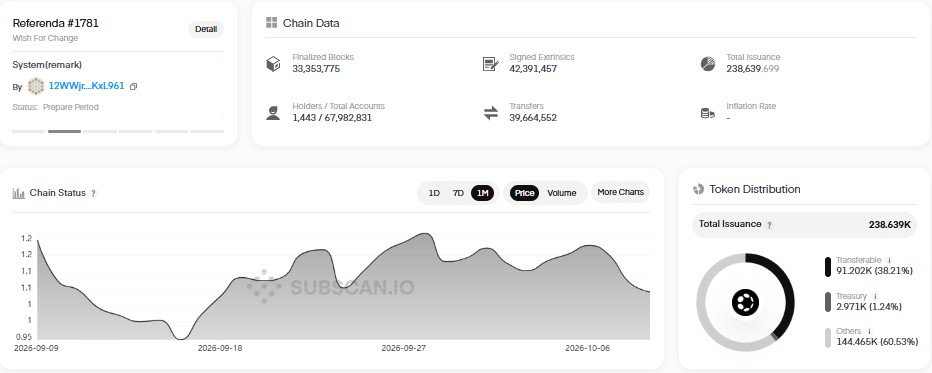
Subscan also lists Referendum #1781, titled Wish For Change, in its prepare period, a sign that OpenGov governance remains active.
Activity counts alone do not equal demand for DOT, but they show the network keeps running at scale.
DOT Price Analysis: Falling Wedge Breakout and Retest
On the monthly chart from TradingView, DOT has slipped out of a monthly falling wedge that dominated the decline from the early 2025 spike. 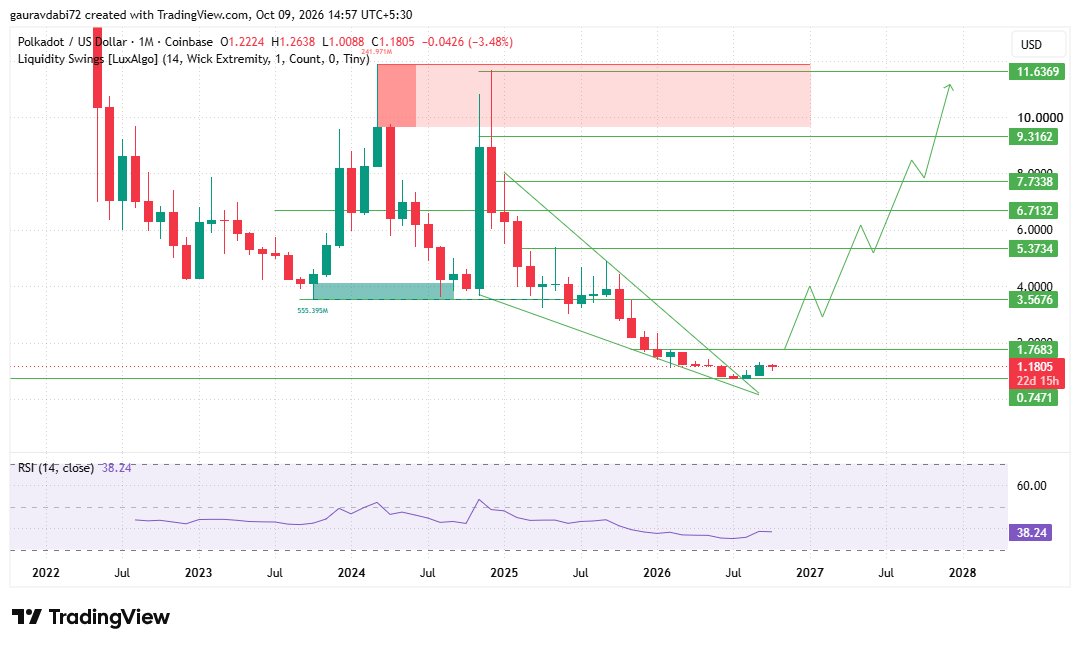
Price found its footing near 0.7471, the key support and the base of the whole recovery, then pushed above the wedge's upper trendline.
The current candle is red, down 3.48%, so the price is retesting the area just above the wedge edge.
RSI at 38.24 sits below the midline but has turned up from its lows, which fits a market that is repairing momentum slowly.
Overhead, 1.7683 is the nearest hurdle, about 50% above price.
A monthly close above it would confirm the shift and open 3.5676, 5.3734, 6.7132, 7.7338, 9.3162, and 11.6369, the last sitting at the edge of the heavy supply zone left by the 2024 and 2025 highs.
Below, 0.7471 is roughly 37% under the current price.
Can DOT Hit $50? What the Numbers Say
At $1.1795, $50 is about 42 times higher. It would imply a market cap near $85B at 1.70B circulating DOT, or about $105B on the 2.10B maximum supply, against $2.02B now.
It also sits more than four times above 11.6369, the top level on the monthly chart.
That is why our Polkadot forecast treats $50 as a distant stretch case. The chart offers a more grounded path, with 1.7683 first and then 3.5676 if the breakout holds.
A move to $50 would need demand far beyond what current volume and open interest suggest.
DOT Outlook: Base, Bull, and Bear Cases
The Polkadot Price Prediction 2030 outlook hinges on 1.7683. In the base case, DOT holds above 0.7471 and builds above the wedge while RSI climbs back toward 50.
The bull case needs a monthly close above 1.7683, which would open 3.5676 and then 5.3734. The bear case is a monthly close below 0.7471, which would undo the breakout and reopen the lows.
These DOT support and resistance levels frame every scenario.
For an earlier outlook, check out our Polkadot Price Prediction 2029 and see how DOT’s key levels and market trend have evolved.
Key Risks for DOT Holders
A monthly close below 0.7471 would negate the breakout. Futures volume running at roughly 6.3 times spot can exaggerate moves in both directions, and open interest that stays high through declines leaves room for sharp unwinds.
dotUSD is a narrative until real usage shows up, and RSI below 50 means rallies still have to prove themselves.
Expert Opinion: How Does the Analyst Desk Read $DOT?
As per the analyst desk, the breakout is early but constructive. Holding above the old wedge edge while the dotUSD story builds is the healthiest outcome for the chart.
The desk wants a monthly close above 1.7683, with open interest steady, before calling the trend changed. Until then, 0.7471 remains the line that protects the recovery.
Conclusion
The Polkadot Price Prediction 2030 outlook rests on a monthly breakout that now has to hold.
Defending the retest keeps 1.7683 in play, while a monthly close below 0.7471 would shift focus back to the lows. $50 stays a distant stretch case, and the nearer chart levels are the realistic ones.
Disclaimer: This article is for informational and educational purposes only and does not constitute financial, investment, or trading advice. Cryptocurrency prices are highly volatile, and readers should do their own analysis and consider their risk tolerance before making any decision.